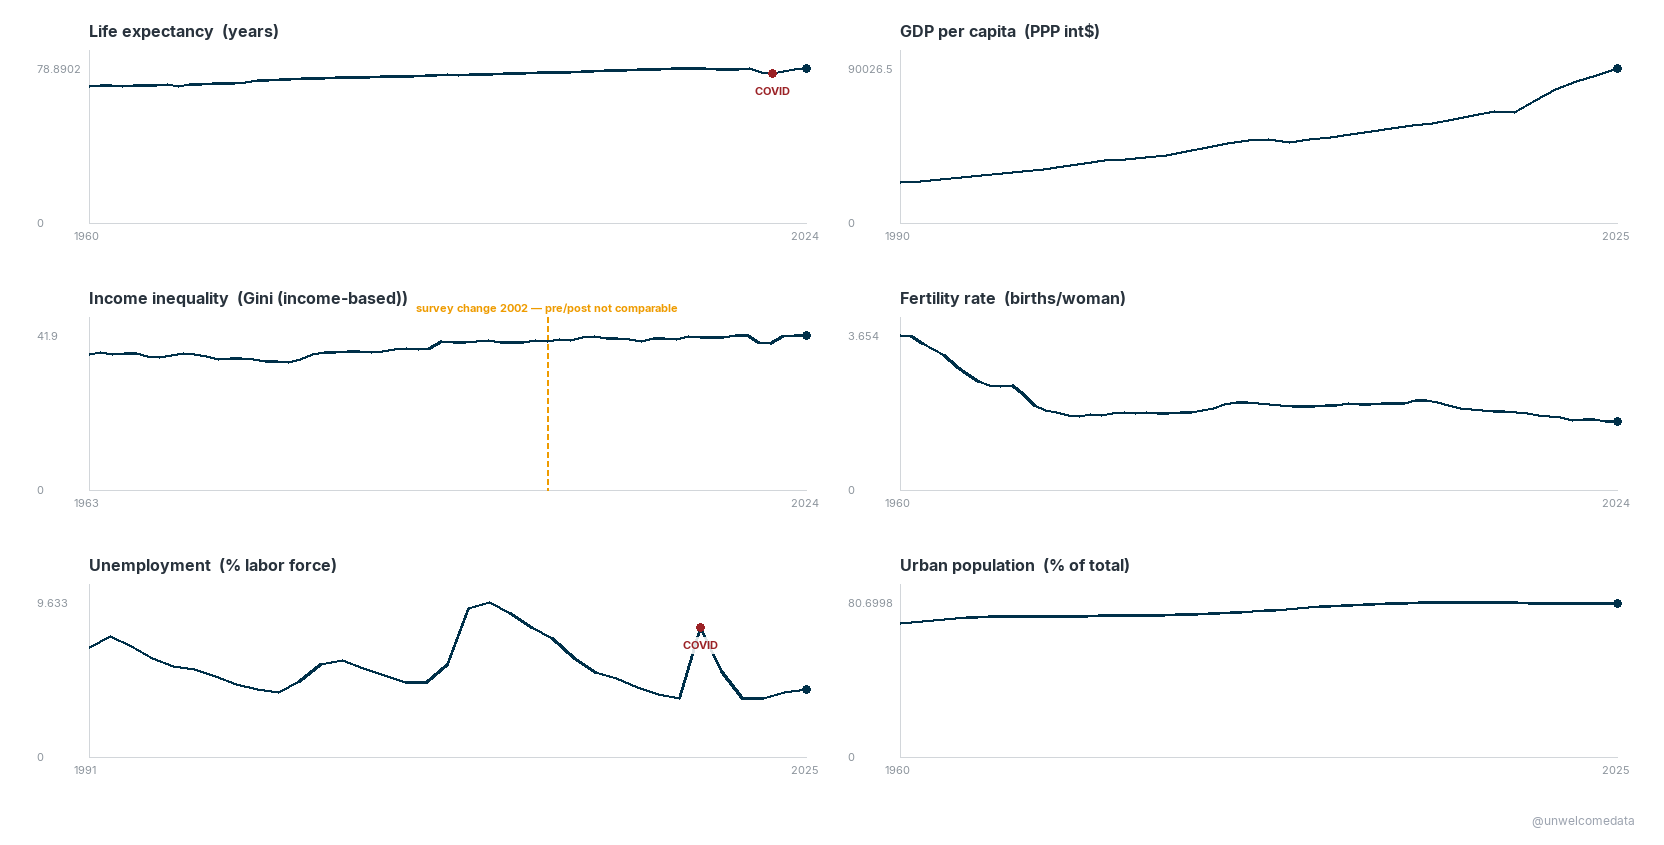
Pick a country to see six metrics over time: life expectancy, GDP per capita (PPP),
income inequality (Gini), fertility, unemployment, and urbanization. Each panel is
0-based (true scale, not zoomed). Gini is measured 0–100 (0 = everyone
equal, 100 = one person has it all) and is labeled income- or consumption-based per
country — the two are not directly comparable. Source: World Bank WDI + PIP;
survey years vary. A gold dashed line marks a documented survey/comparability break.
Some countries have little or no survey data for a given metric; those panels read
“(no data).” A small number of series with demographically implausible source values
are suppressed and labeled as such (e.g. Central African Republic life expectancy, a
World Bank modeling artifact). Data ties back to the World Bank source in every case.