@unwelcomedata · data from public sources
How Countries Compare
Six everyday measures — income, inequality, life expectancy, fertility, unemployment, and urbanization — for every country, from the World Bank. The through-line: you can’t rank the world’s inequality on a single list. The Gini index everyone quotes is measured two different, non-comparable ways depending on the country, so honest comparison means keeping them apart — which is exactly what these charts do.
The Gini index (0–100) measures how evenly income or spending is shared: 0 = everyone equal, 100 = one person has it all (higher = more unequal). It’s collected two ways — income-based surveys (typically richer countries) and consumption-based surveys (typically lower- and middle-income countries) — and the two are not directly comparable. Income Ginis run several points higher on average purely from method. Every chart here shows the two survey types separately and never merges them. Source: World Bank WDI + Poverty & Inequality Platform (PIP); survey years vary by country.
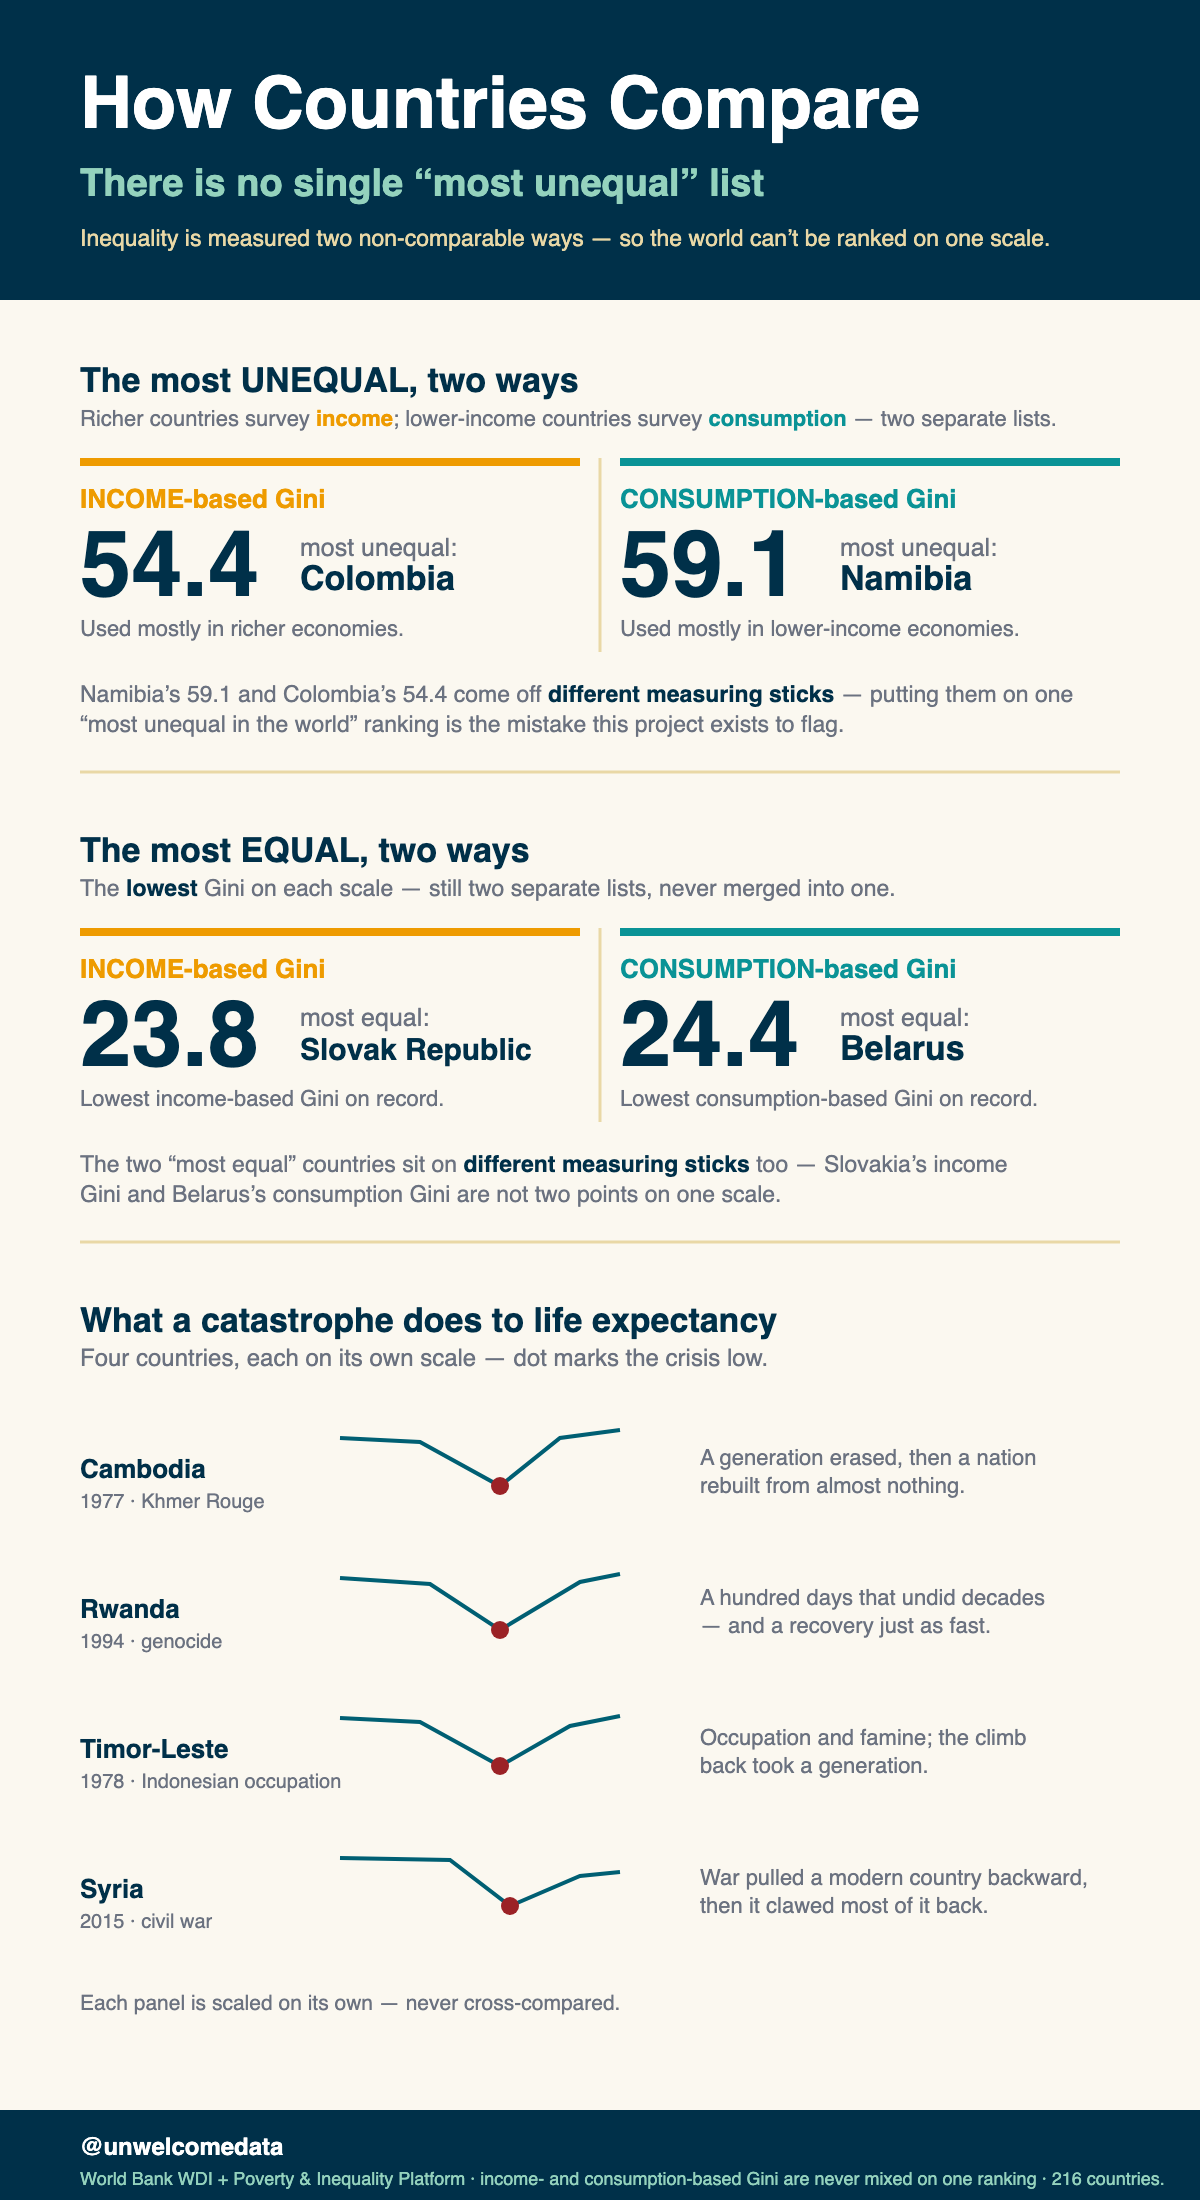
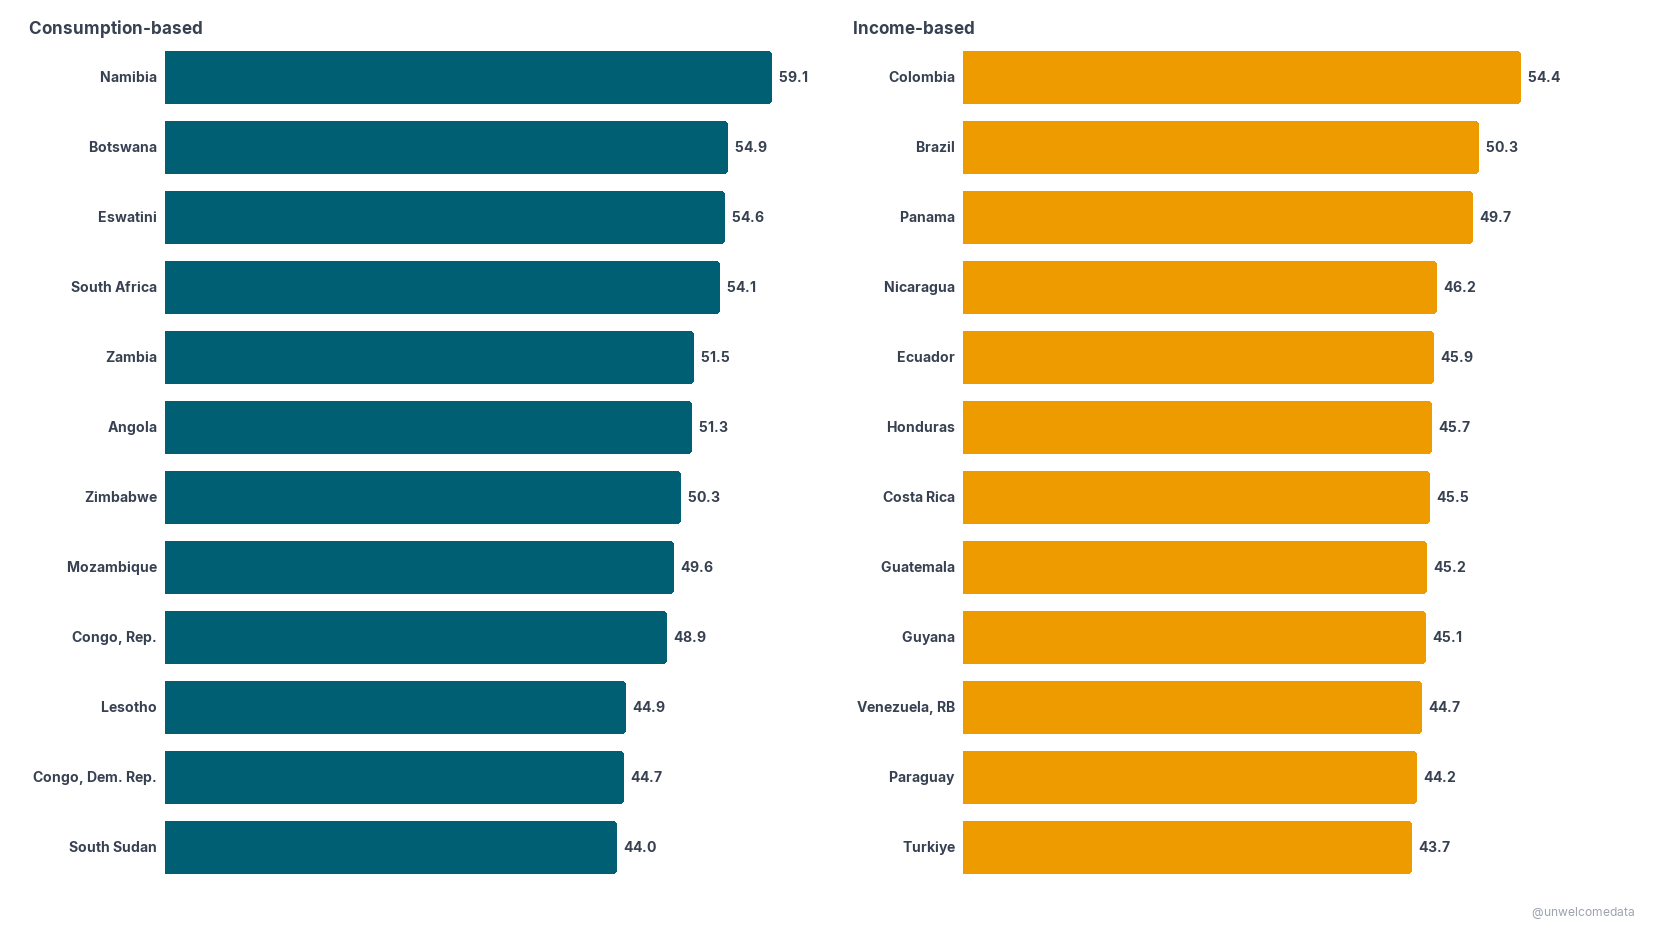
The most unequal — and the most equal — by survey type
Highest Gini, each survey type shown separately. Left: consumption-based surveys (top: Namibia 59.1). Right: income-based (top: Colombia 54.4). The two sides are not comparable — that’s the point of splitting them.
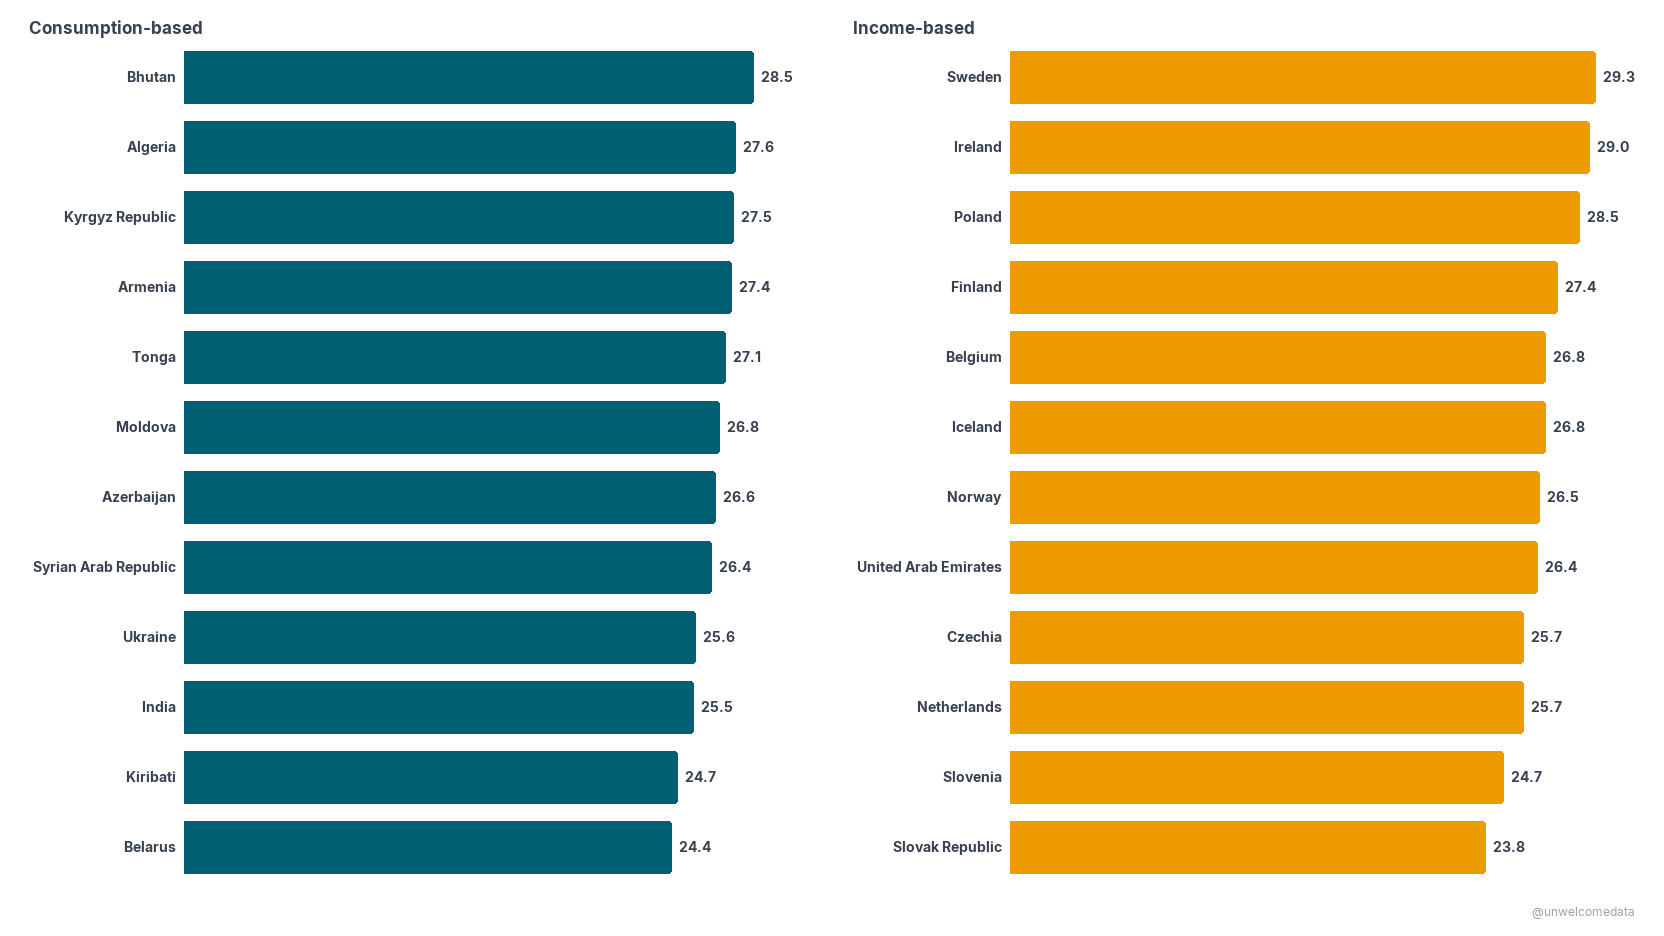
Lowest Gini, each survey type shown separately. Lower = more equal. India’s low consumption-based value partly reflects the metric (consumption spreads narrower than income), not equality alone.
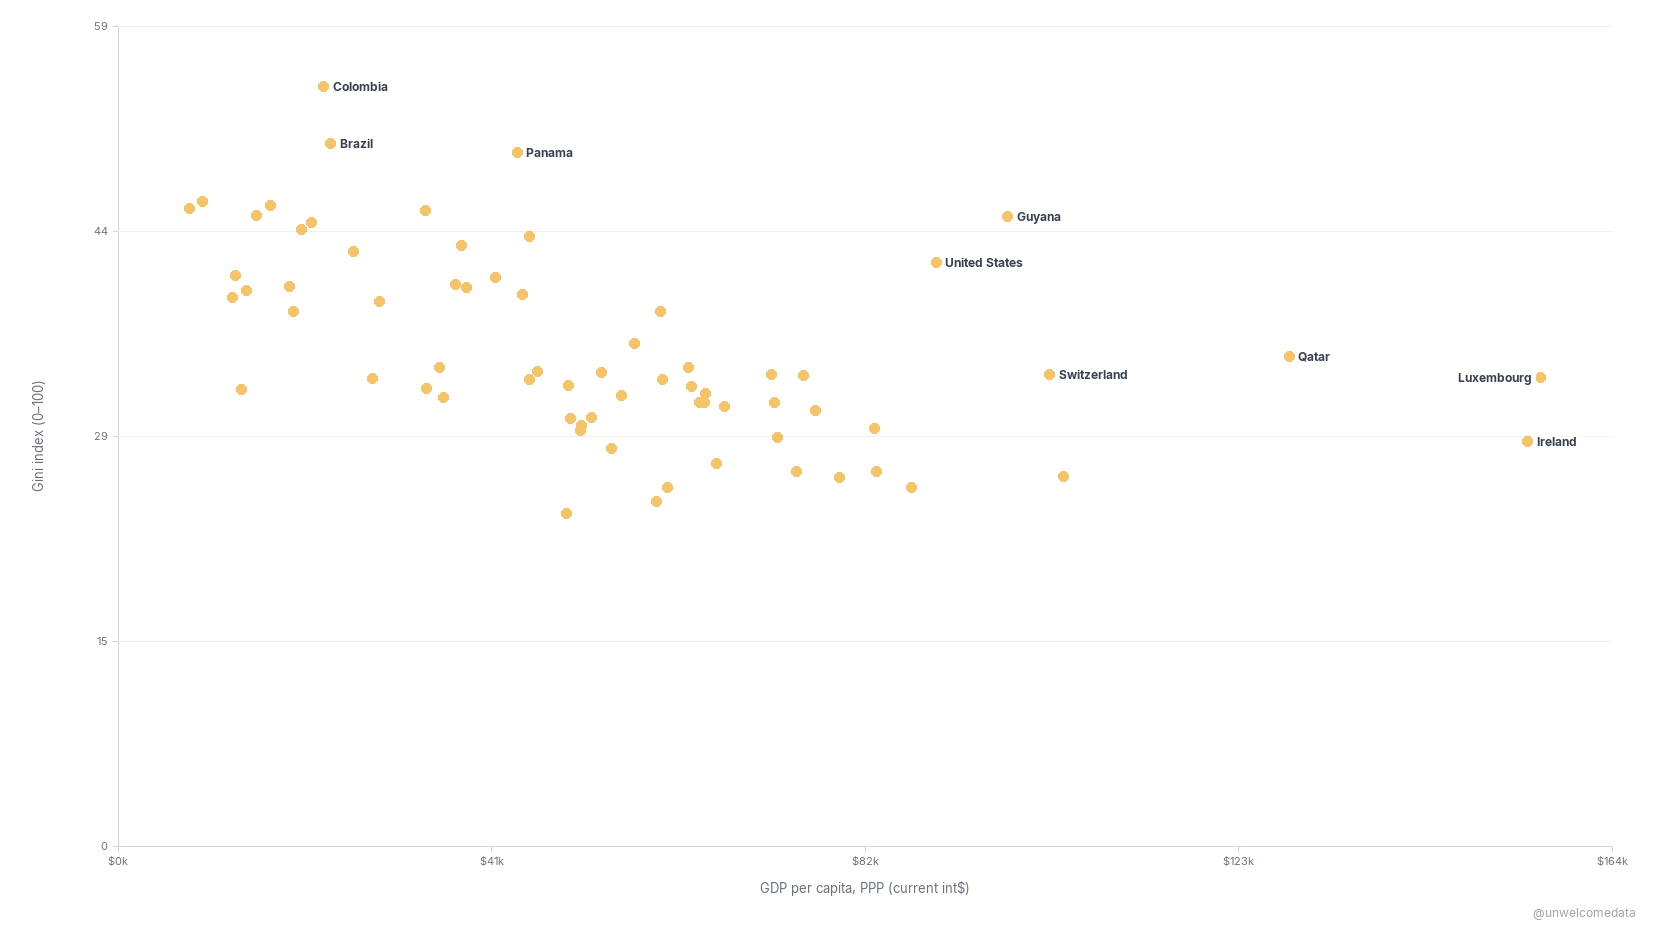
Wealth vs inequality
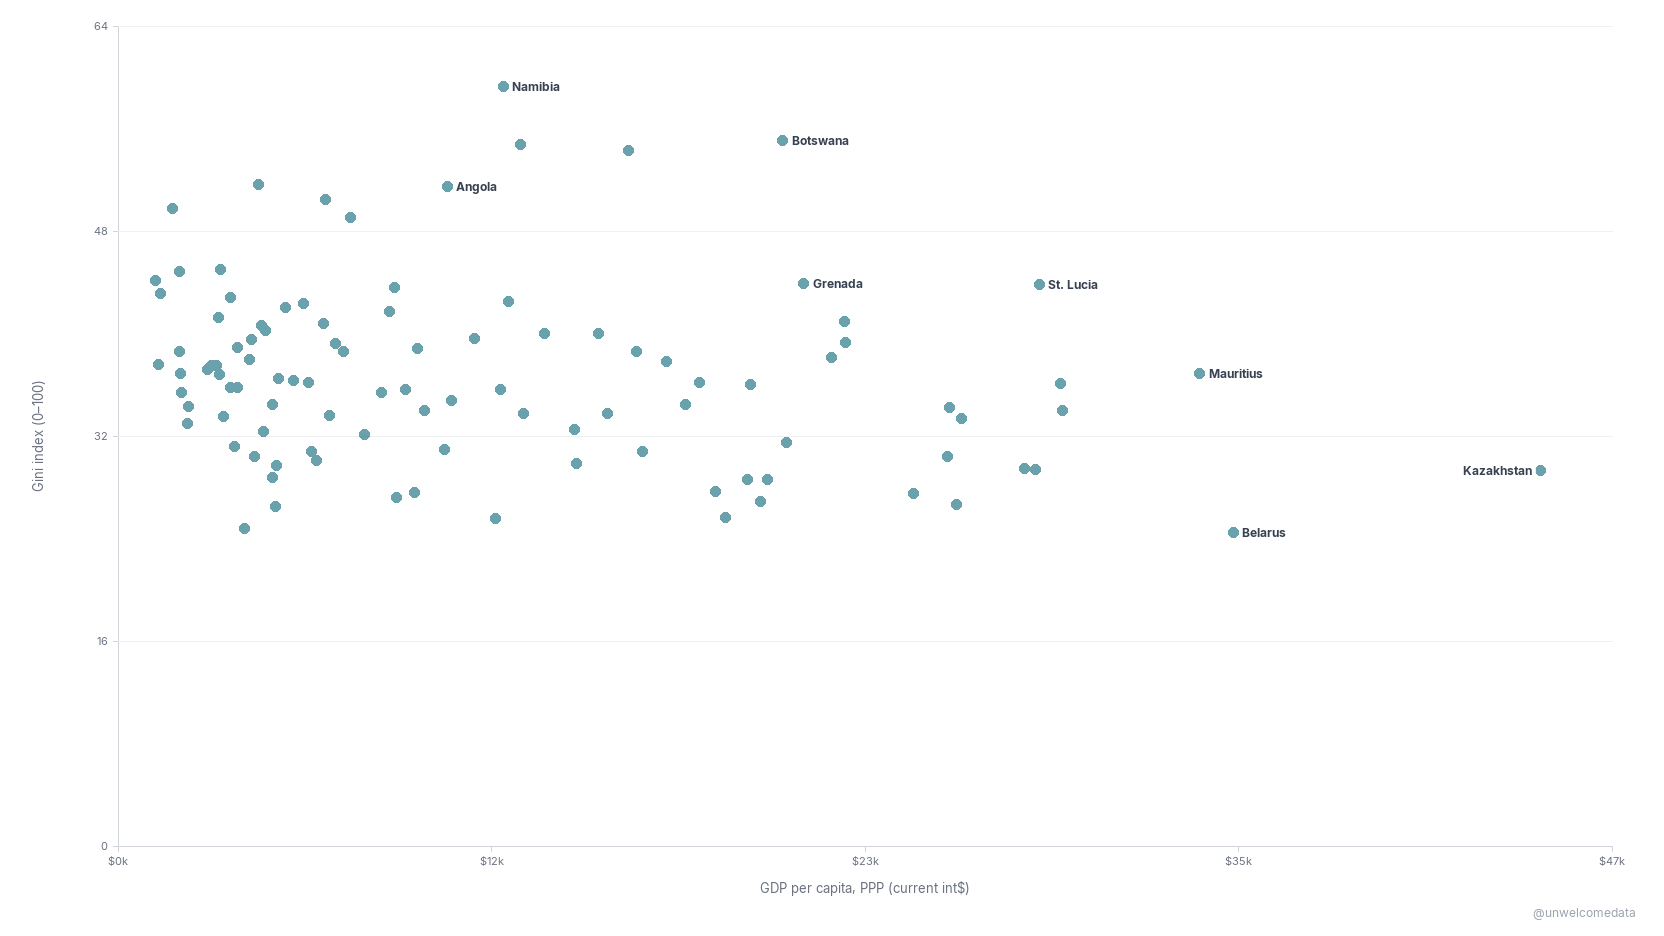
Income-based countries only. Richer countries here are clearly more equal (correlation r ≈ −0.51). The United States is labeled for context: rich, but unusually unequal for a wealthy country.
Consumption-based countries only. The wealth–equality link is weaker here (r ≈ −0.23). The US is not on this chart — its Gini is income-based, so it appears on the income chart above, never mixed in.
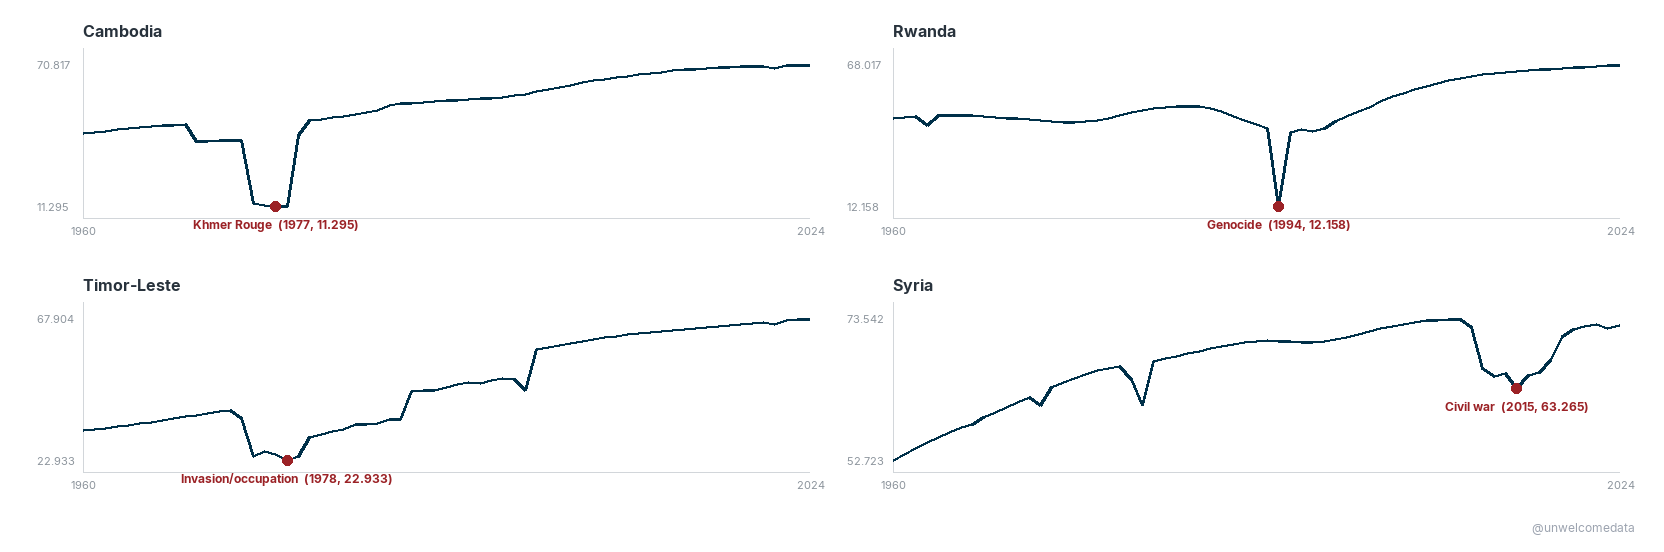
When catastrophe collapses life expectancy
Life expectancy at birth, in years. Each panel is one country on its own scale; the marked dot is the low point and the event that caused it — the Khmer Rouge (Cambodia), the 1994 genocide (Rwanda), the 1975–78 invasion/occupation (Timor-Leste), and the civil war (Syria, 2015).
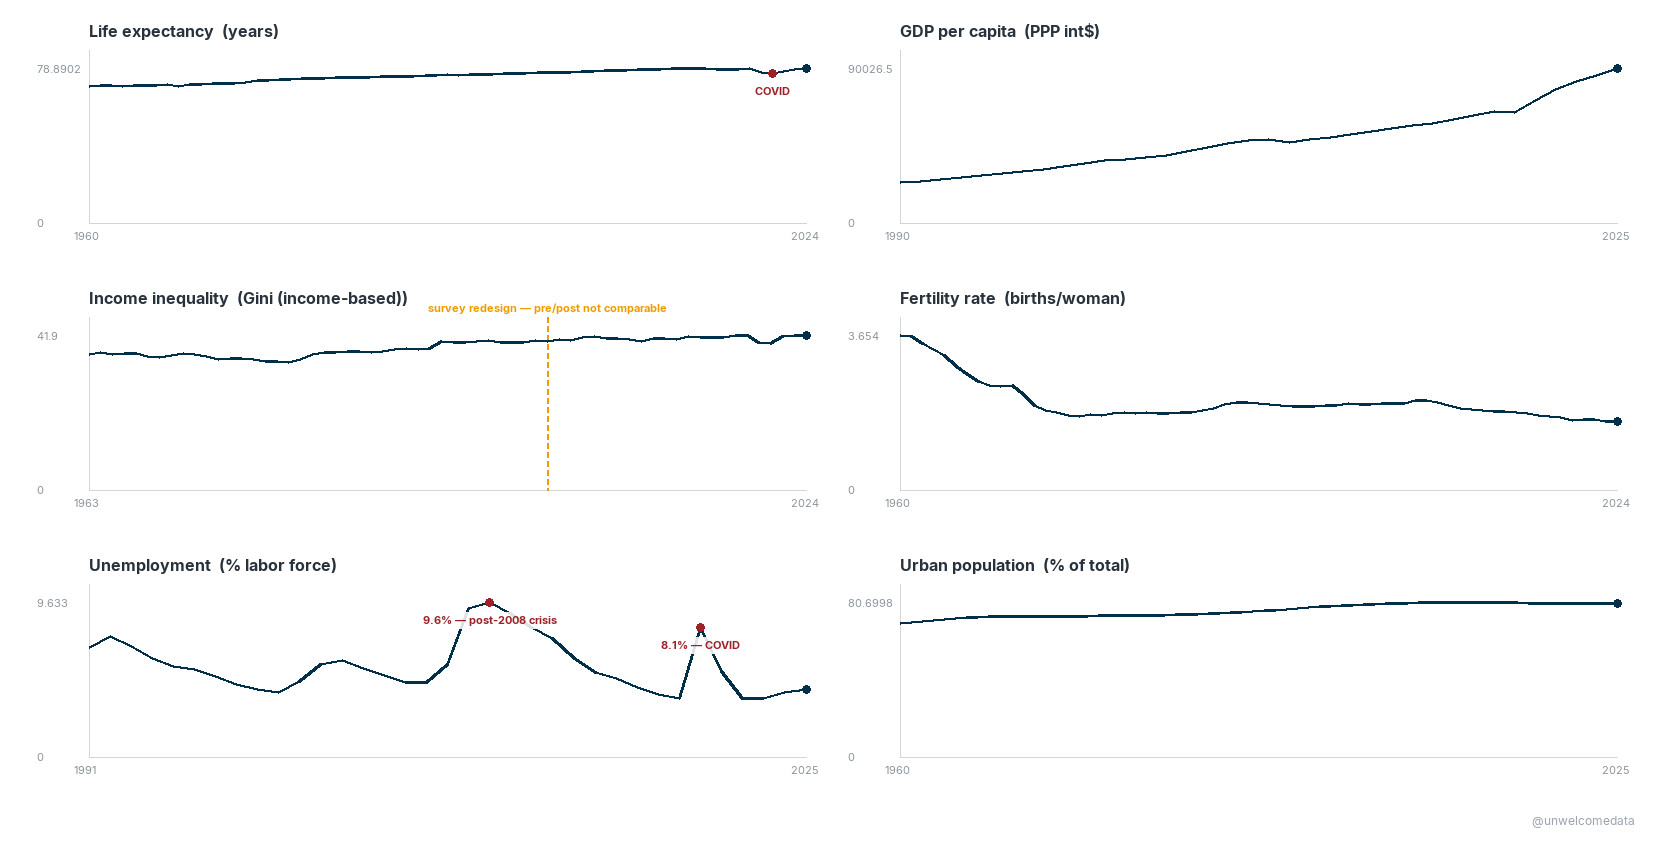
The United States, up close
The US across the key metrics over time. Each panel is 0-based (true scale, not zoomed), so spikes and dips aren’t exaggerated. Inequality shown is the income-based Gini.
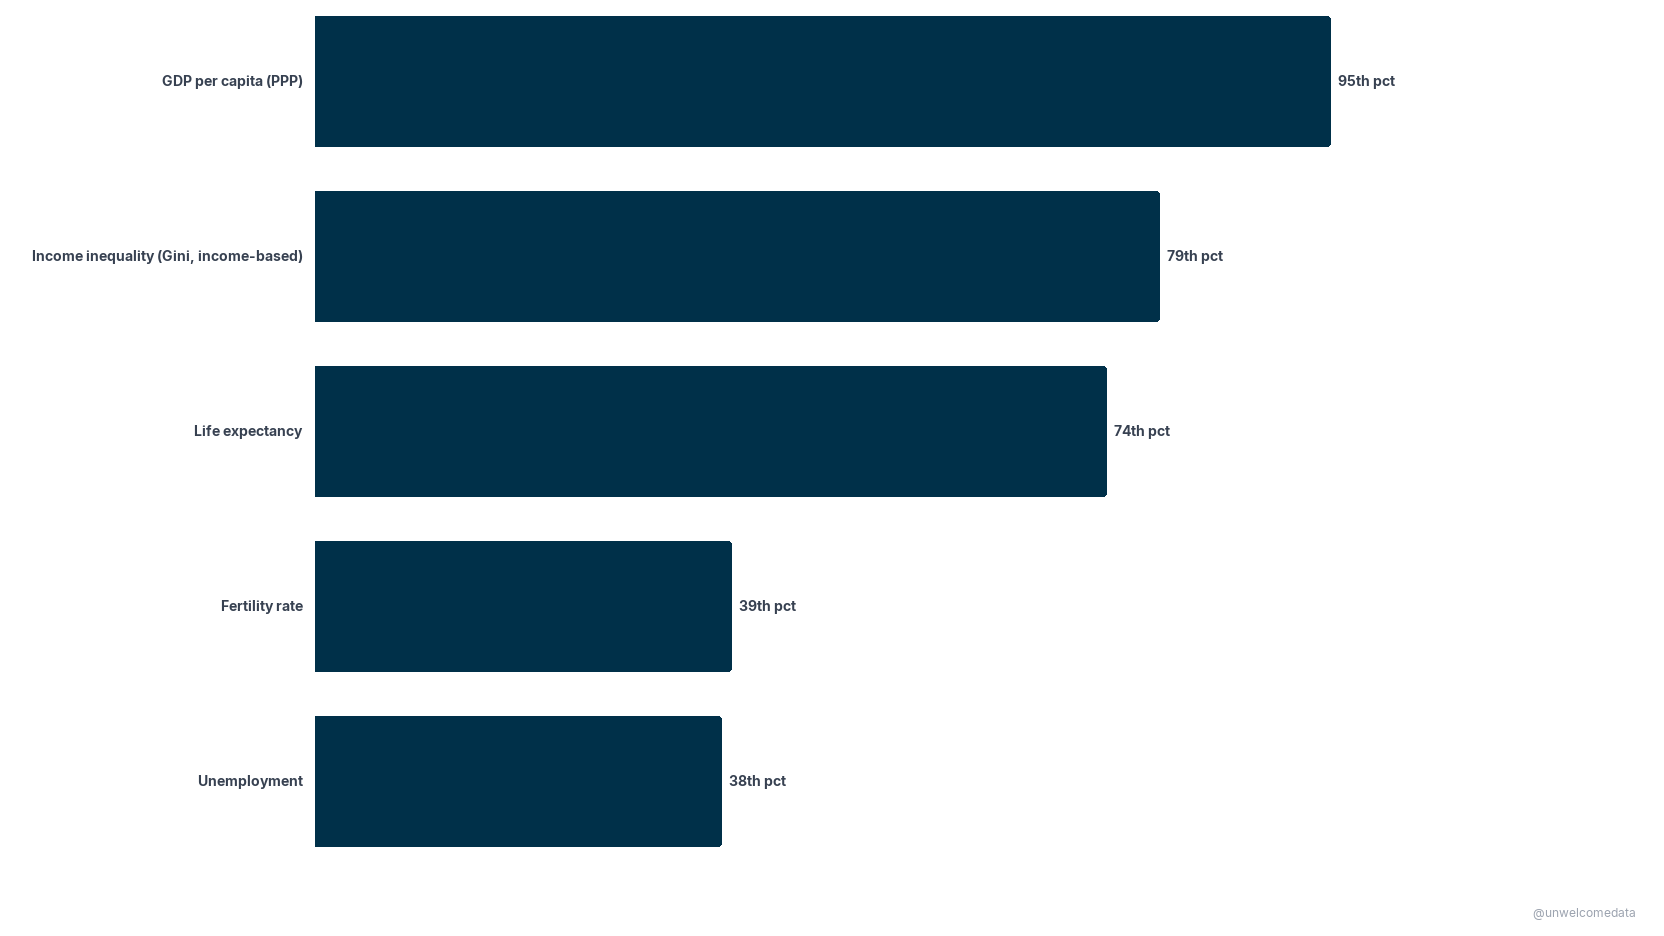
Where the US ranks in the world — US global percentile on each metric (100th = highest, 0th = lowest). Inequality (Gini) is ranked against income-based countries only. The US is extremely rich (95th) and unusually unequal (79th), but only middling on life expectancy (74th).
Every country, one at a time
Pick any country to see all six metrics over time on one page: → Country profiles (interactive picker)
The data
The full dataset is in export/:
countries_latest_v1.csv— one row per country, latest available value per metric (what the ranking and scatter charts are built from), plus each country’s Gini survey type and Gini year.countries_panel_v1.csv— the full country × year panel (all metrics, 1960–2025 where available).- Each ships with a codebook (
*_codebook.md) describing every column in plain English.
How it was measured
- Inequality = the Gini index (0–100). Its single most important caveat is the income vs consumption split (see the note at the top). This project never ranks an income-Gini country against a consumption-Gini country; the US is ranked only against other income-based countries.
- Gini is not annual. A country’s value reflects its nearest household-survey year, not every calendar year. Survey years vary widely.
- Correlations (r ≈ −0.51 income, r ≈ −0.23 consumption) are Pearson correlations of Gini vs GDP per capita (PPP) within each survey pool.
- One caveat worth stating: a small number of World Bank series carry demographically implausible values (e.g. Central African Republic life expectancy, a modeling artifact); those are suppressed and labeled rather than shown. Every value on these charts ties back to the World Bank source.
Reproduce it
The pipeline is reproducible from the source APIs. The ingest → clean → export logic lives in
src/ (ingest.py, clean_quality.py, prepare.py), driven by config.yaml:
pip install -r requirements.txt
python scripts/reproduce.py        # fetch World Bank WDI + PIP → clean → export
python scripts/validate_charts.py  # re-checks every chart's facts against the data
reproduce.py is standalone — it runs the src/ pipeline directly (no notebooks needed) and its
output is byte-for-byte identical to the published exports. See
scripts/README.md for the stage-by-stage details.
Sources & license
Full attribution, definitions, and methodology/series-break notes are in SOURCES.md. Data: World Bank WDI + PIP (CC-BY 4.0) and ISO 3166 / UN geoscheme region codes. This project’s code and charts are shared for public, non-commercial reference.
Further exploration
- Regional patterns (the panel carries UN region / sub-region groupings).
- Within-country change over time where a comparable survey spell exists (breaks are flagged).
- How the income-vs-consumption gap itself varies by region.
AI-assisted development. This project was built with the assistance of Kiro, an AI-powered development environment. All data-sourcing decisions, methodology choices, and published findings are the author’s. AI was used for code generation, pipeline construction, and research assistance — not for analytical conclusions or editorial judgment.