@unwelcomedata · data from public sources Follow for new charts: X · Bluesky
The shape of video game review scores
What do game review scores actually look like when you pile them all up? Using 6,005 games from IGDB (each with at least three critic scores), this is the distribution of critic ratings, the same for user ratings, how the two have moved over 20 years, and where players and critics disagree the most.
The findings:
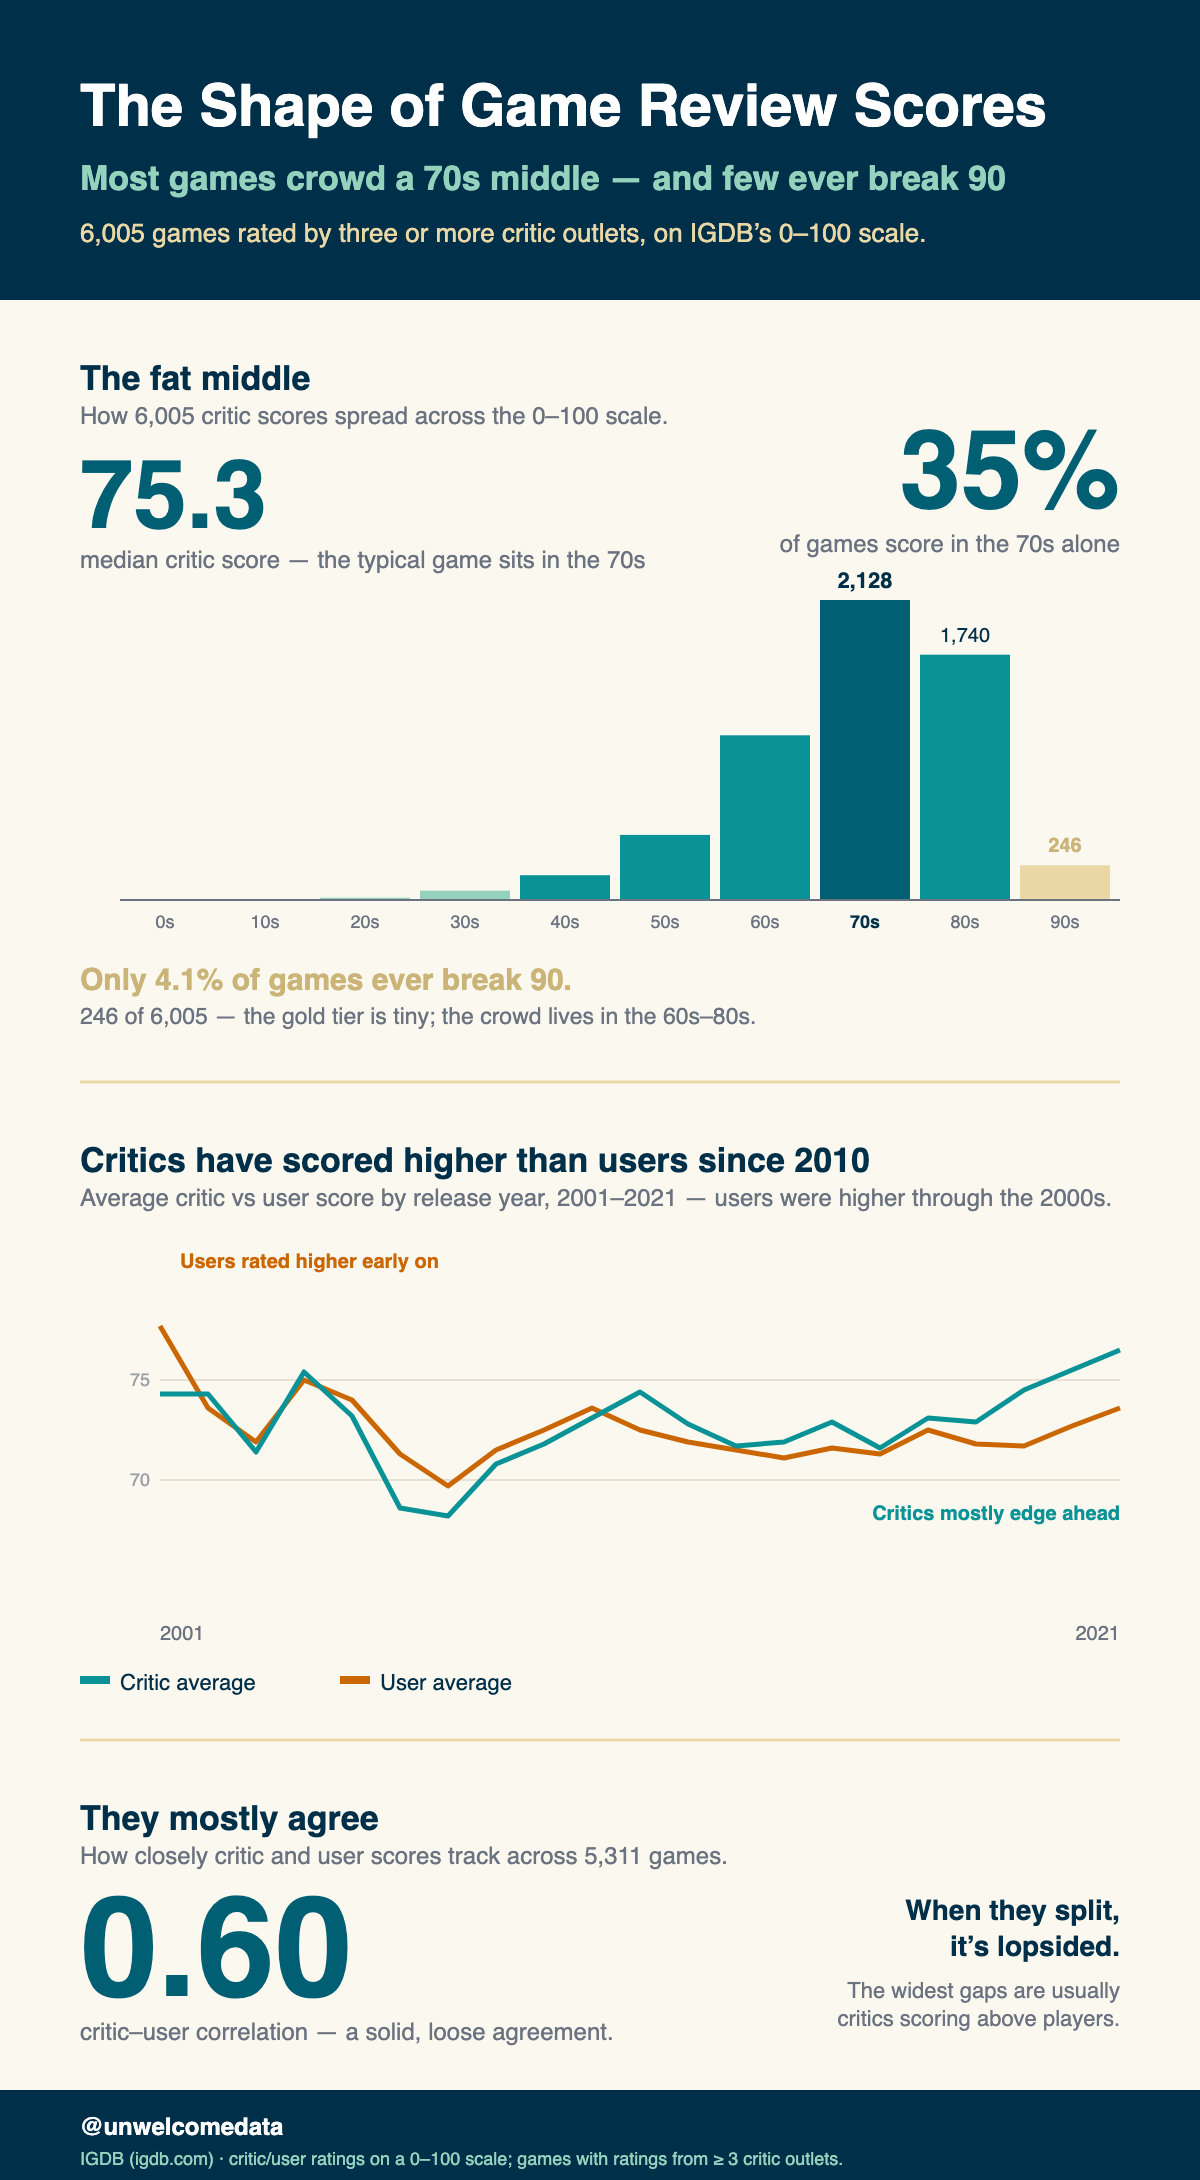
- Almost everything scores in the 70s and 80s. The 70s alone are the fat middle — about 35% of all games. A left-skewed pile, not a bell curve centered at 50.
- A 90+ score is rare. Only ~4% of games clear 90 on the critic scale; the “elite” tail is thin. So is the bad tail — genuinely low scores (under 50) are just as uncommon.
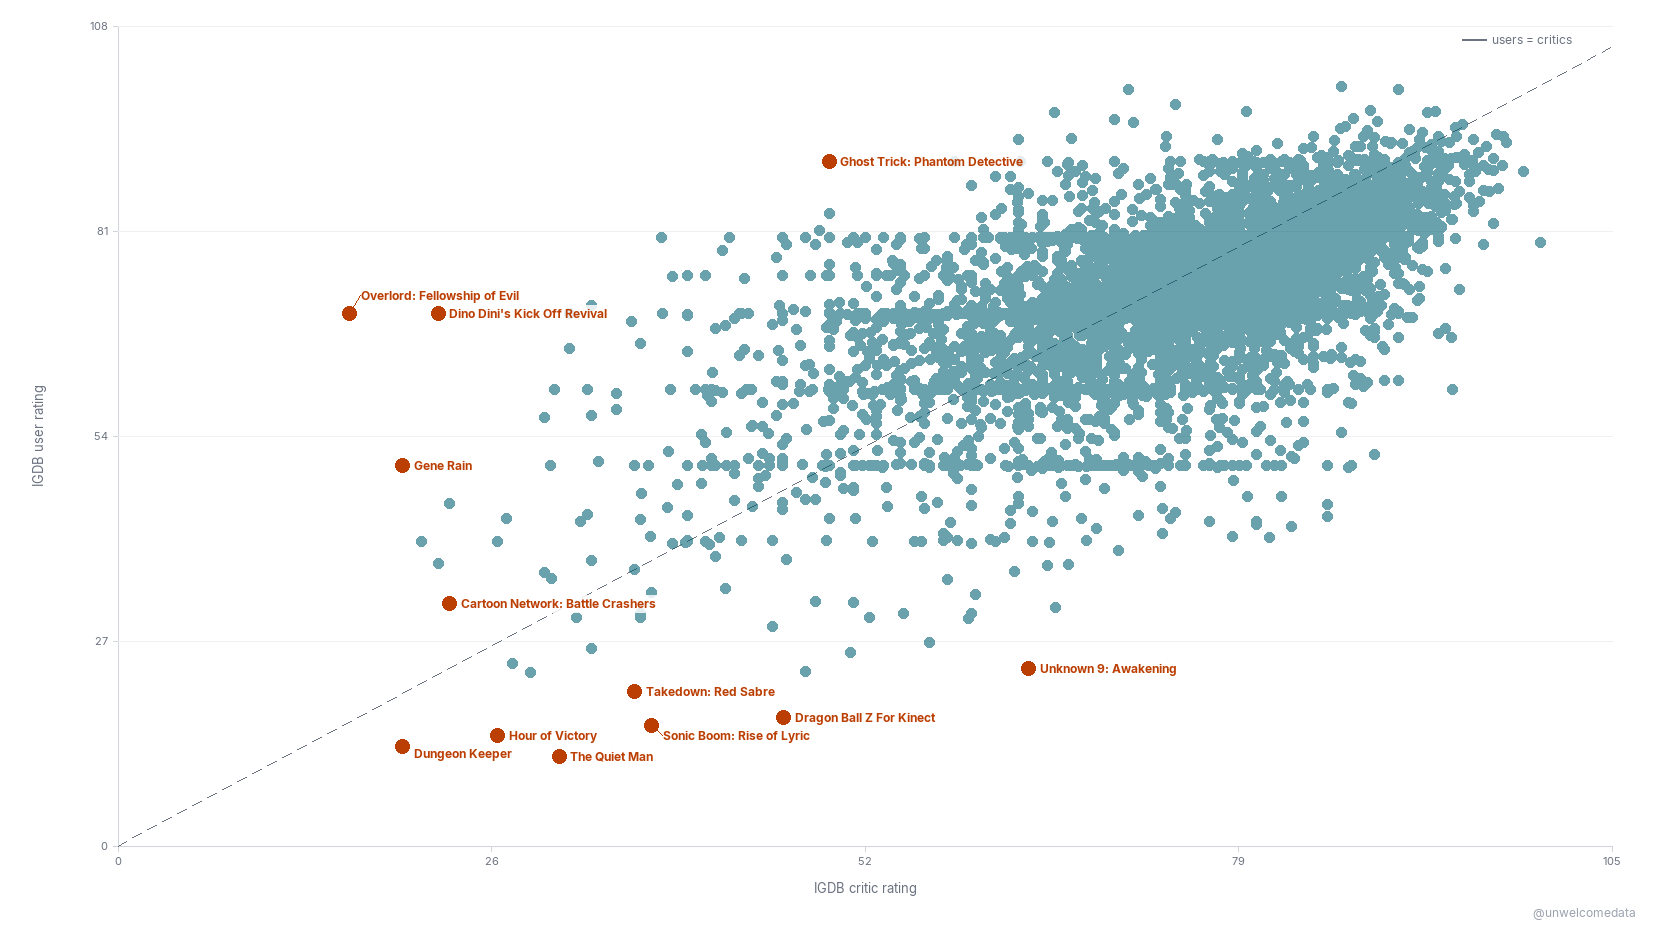
- Users and critics broadly agree, but not perfectly (correlation r = 0.60). Where they diverge, it’s usually critics scoring a game well above the players.
- Critics and users changed places over time. Through the 2000s users rated games higher than critics on average; since about 2010 critics have drifted up while users held flat — so critic averages now sit above user averages.
Click any chart to open it at full resolution.
1. Critic review scores
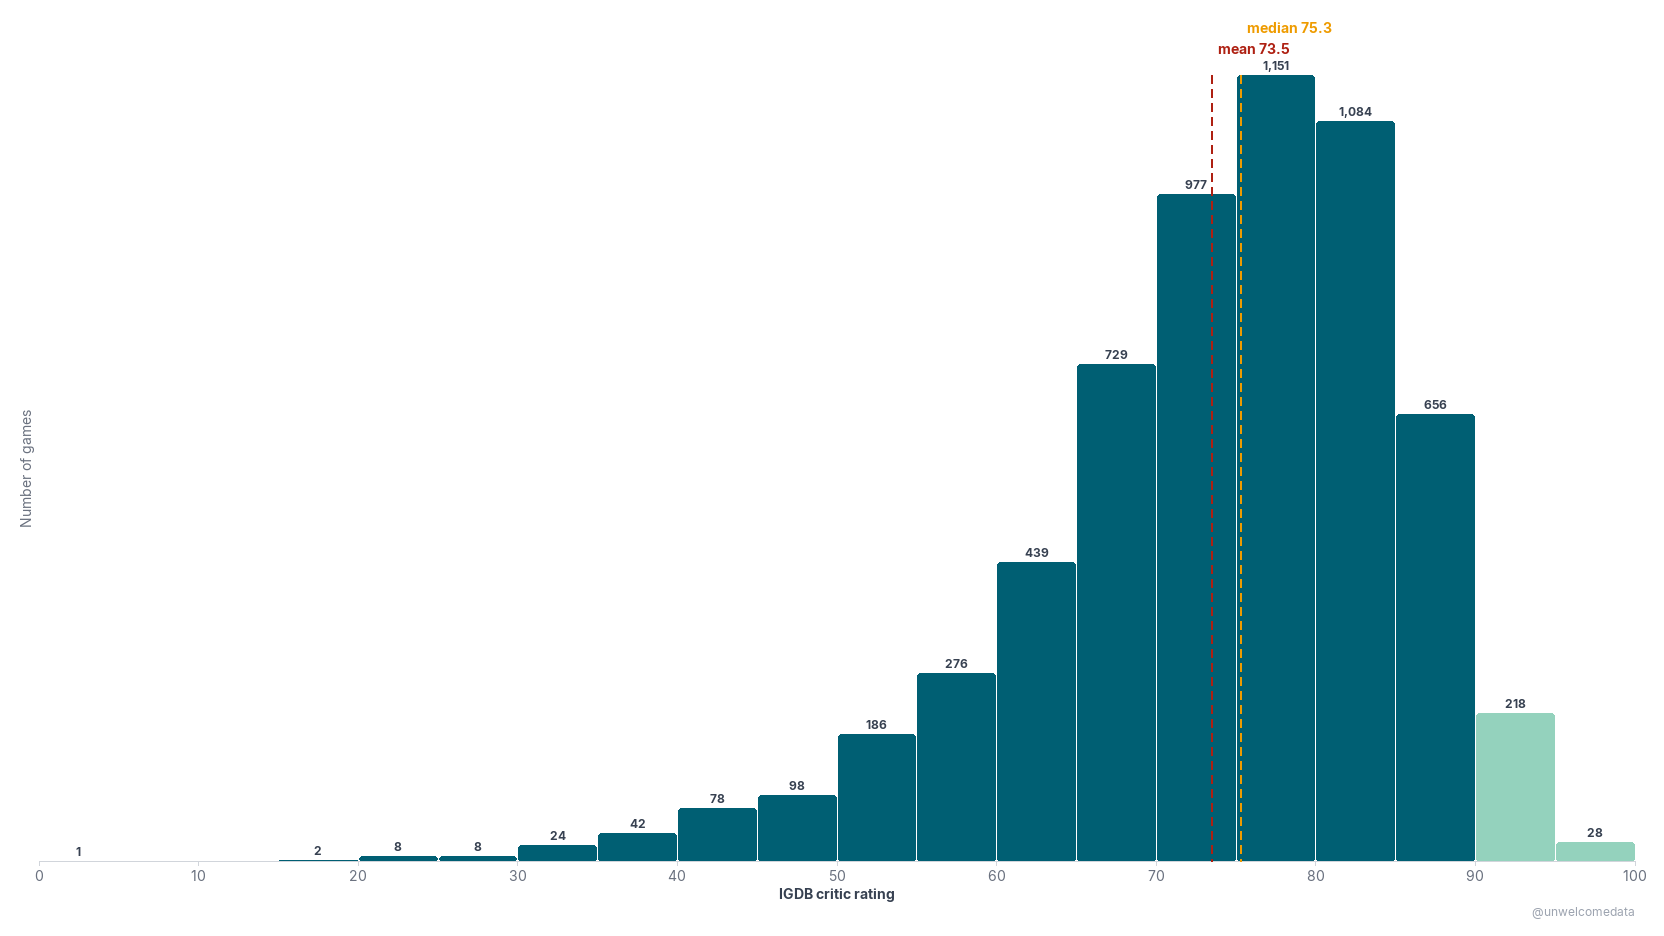
Every game’s IGDB critic rating, binned into 5-point bands. The pile sits in the 70s–80s, the average (mean 73.5 / median 75.3) lands right in it, and the 90+ club (highlighted) is a thin sliver on the right.
2. User review scores
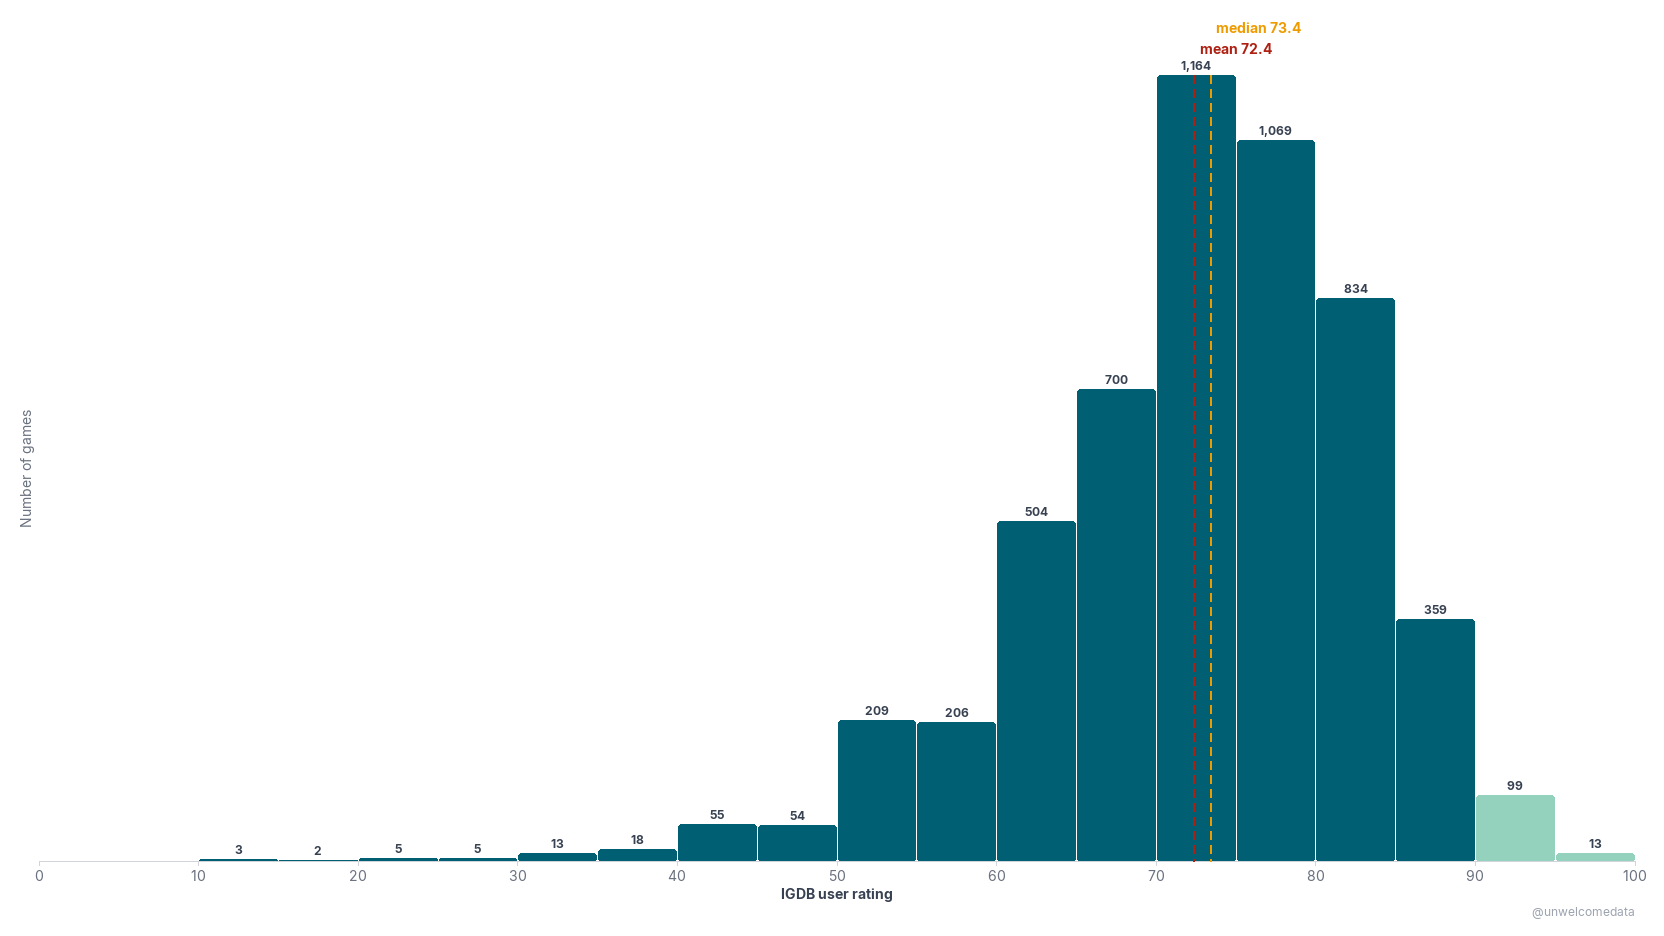
The same treatment for IGDB user/community ratings (the games that have one). Same shape, shifted very slightly lower and tighter (mean 72.4 / median 73.4) — players hand out top marks even more sparingly than critics.
3. Critics vs. users, over time
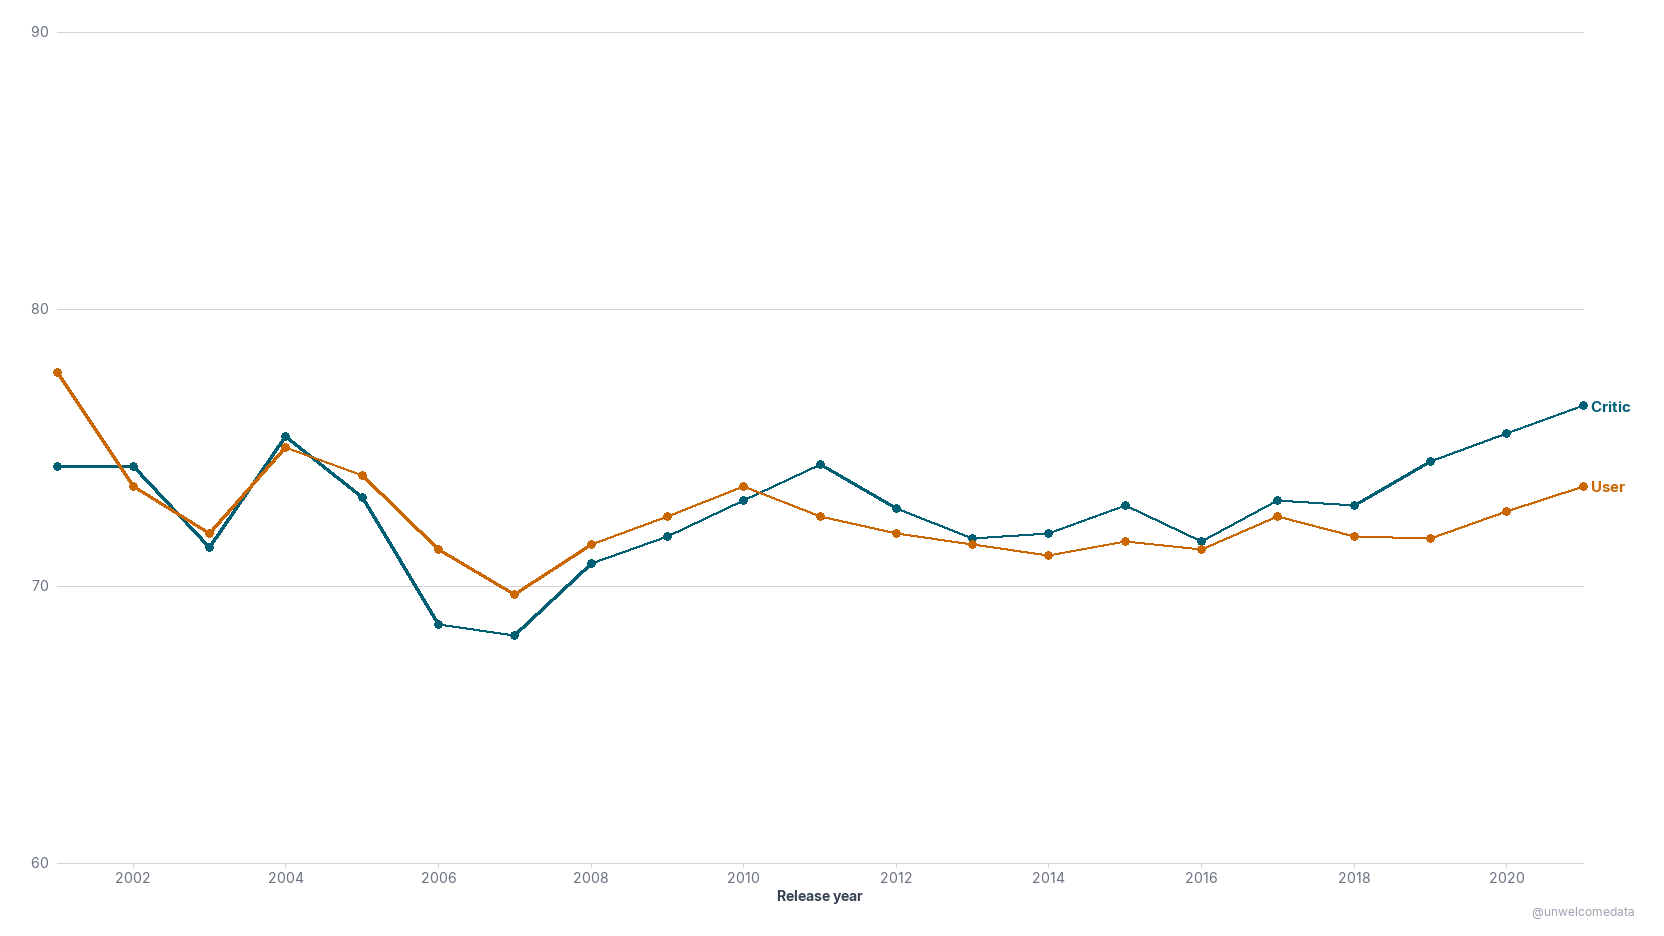
The average critic rating and average user rating for each release year (2001–2021, years with at least 10 scored games). The lines cross around 2010–11: users led in the 2000s, critics have led since.
4. Where players and critics disagree
Every game with both a critic and a user rating (5,311 of them), plotted against each other with a dashed “users = critics” line. Most of the cloud hugs that line. The dozen games standing most alone — the ones with the most empty space around them — are highlighted and named. They’re the oddballs on the edges of the plot: mostly low-scoring flops both sides panned (The Quiet Man, Sonic Boom: Rise of Lyric, Dungeon Keeper), a few where the two camps split hard (Unknown 9: Awakening, Overlord: Fellowship of Evil), and the occasional cult favorite players rated far above critics (Ghost Trick: Phantom Detective).
How it’s measured
- Metric: IGDB’s own aggregate scores on a 0–100 scale.
critic_ratingis IGDB’s mean of the external professional-critic scores it has collected;user_ratingis IGDB’s community rating. These are two separate measures — never blended — and they are IGDB’s numbers, not Metacritic’s (a different aggregator with a different method). - Who’s included: games with a critic aggregate backed by ≥ 3 critic scores, so a single stray review can’t create a noisy “aggregate.” That’s the 6,005-game universe; the user charts cover the 5,312 of those that also carry a community rating, and the scatter the 5,311 with both (one game with a critic score of exactly 0 — an IGDB data gap — is dropped).
- “Most isolated” outliers: on the scatter, the labelled games are the 12 with the most empty space around them (measured by distance to their nearest neighbours), i.e. the ones the eye reads as standing apart — not simply the biggest raw gaps.
- Caveat: IGDB’s critic aggregate is a simple mean of whatever outlets it has, so coverage varies by title and era and scores drift upward over time. Treat the year-over-year comparison as directional, and very recent releases (still accruing scores) are excluded from the yearly lines.
The data
The published dataset is in export/ with a codebook describing every
column:
video_game_scores_v1.csv— one row per game: name, critic rating + count, user rating + count, release year, decade, genres, platforms.
Sources & license
Scores are from IGDB — the Internet Game Database (owned by Twitch/Amazon), queried through its public API. Free for non-commercial use under the Twitch Developer Services Agreement, with attribution to IGDB. Full attribution, definitions, and caveats in SOURCES.md. These are publicly available review aggregates, transformed into new distributions and attributed here — not a redistribution of IGDB’s database.
AI-Assisted Development This project was built with the assistance of Kiro, an AI-powered development environment. All data-sourcing decisions, methodology choices, and published findings are the responsibility of the author. AI was used for code generation, data-pipeline construction, and research assistance — not for analysis conclusions or editorial judgment.