@unwelcomedata · data from public sources
Taskmaster: who really dominated?
A cross-series comparison of every contestant on Taskmaster (UK), series 1–21 — 105 contestants in all.
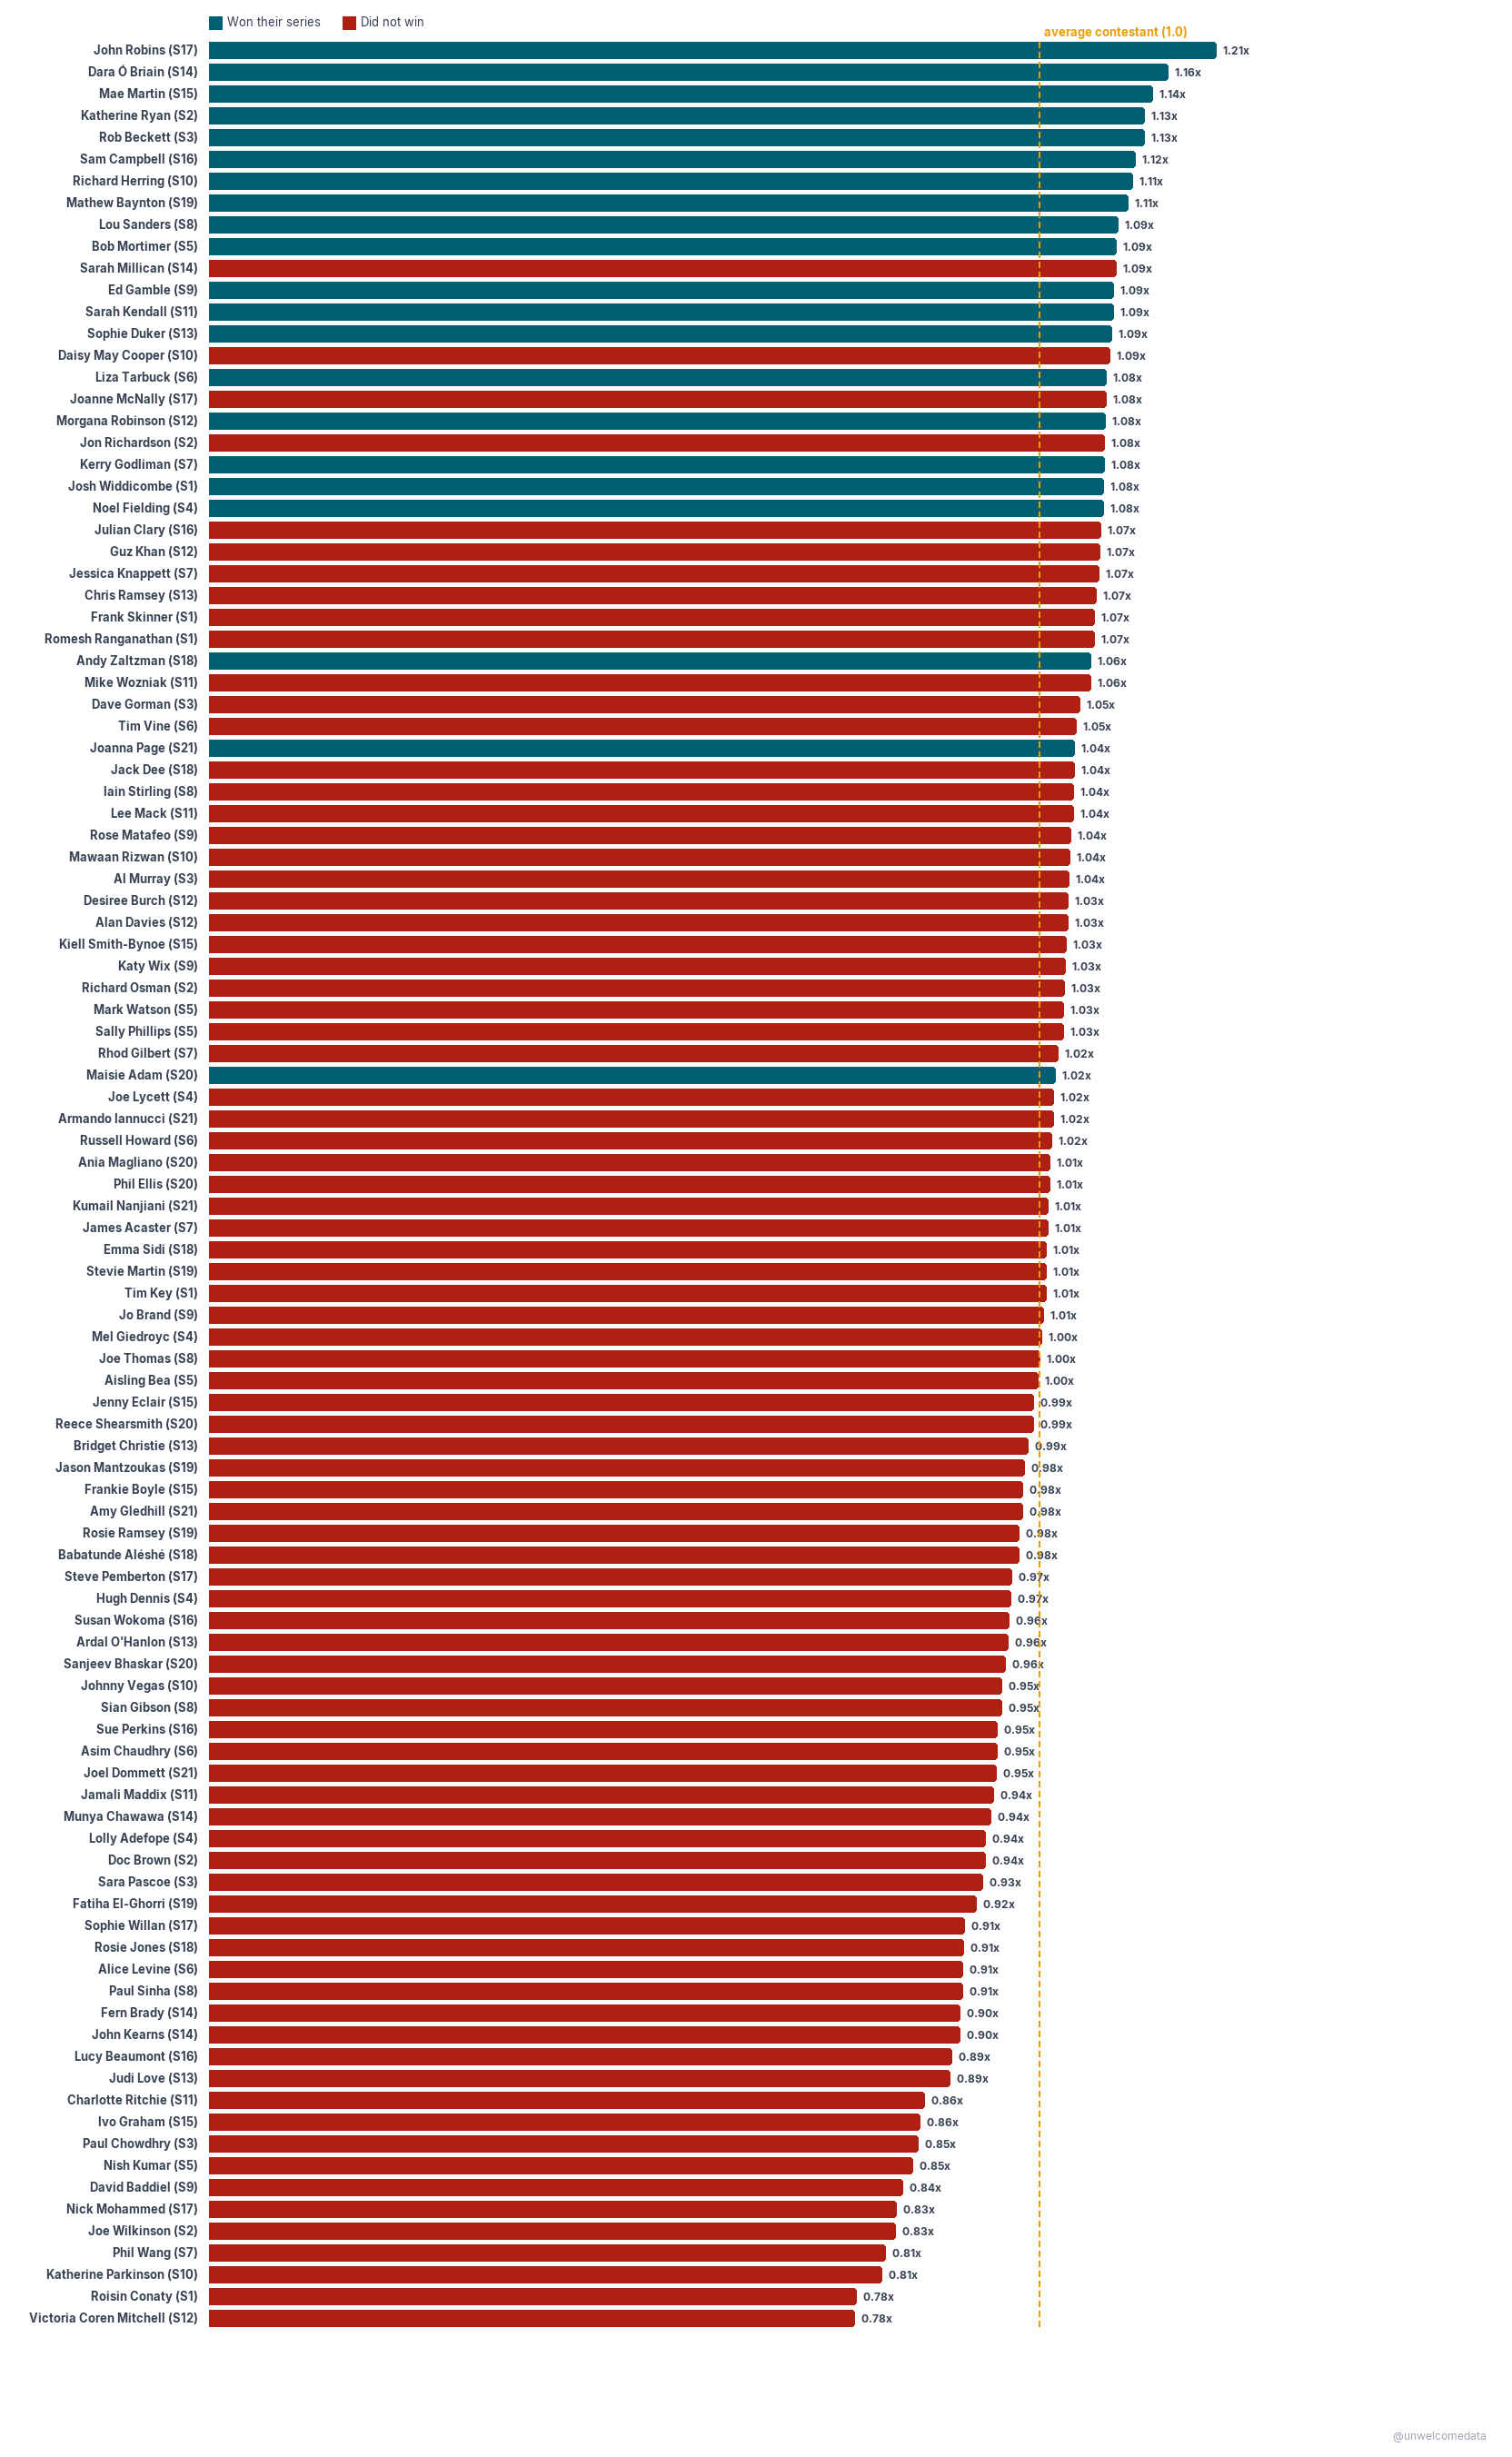
The problem: series aren’t the same length (6, 5, 8, or 10 episodes), so raw point totals can’t be compared directly — a contestant in a 10-episode series has far more points awarded than the winner of a 5-episode series. So instead of raw points, every contestant is scored by their share of their own series’ points, which puts all 21 series on one common scale.
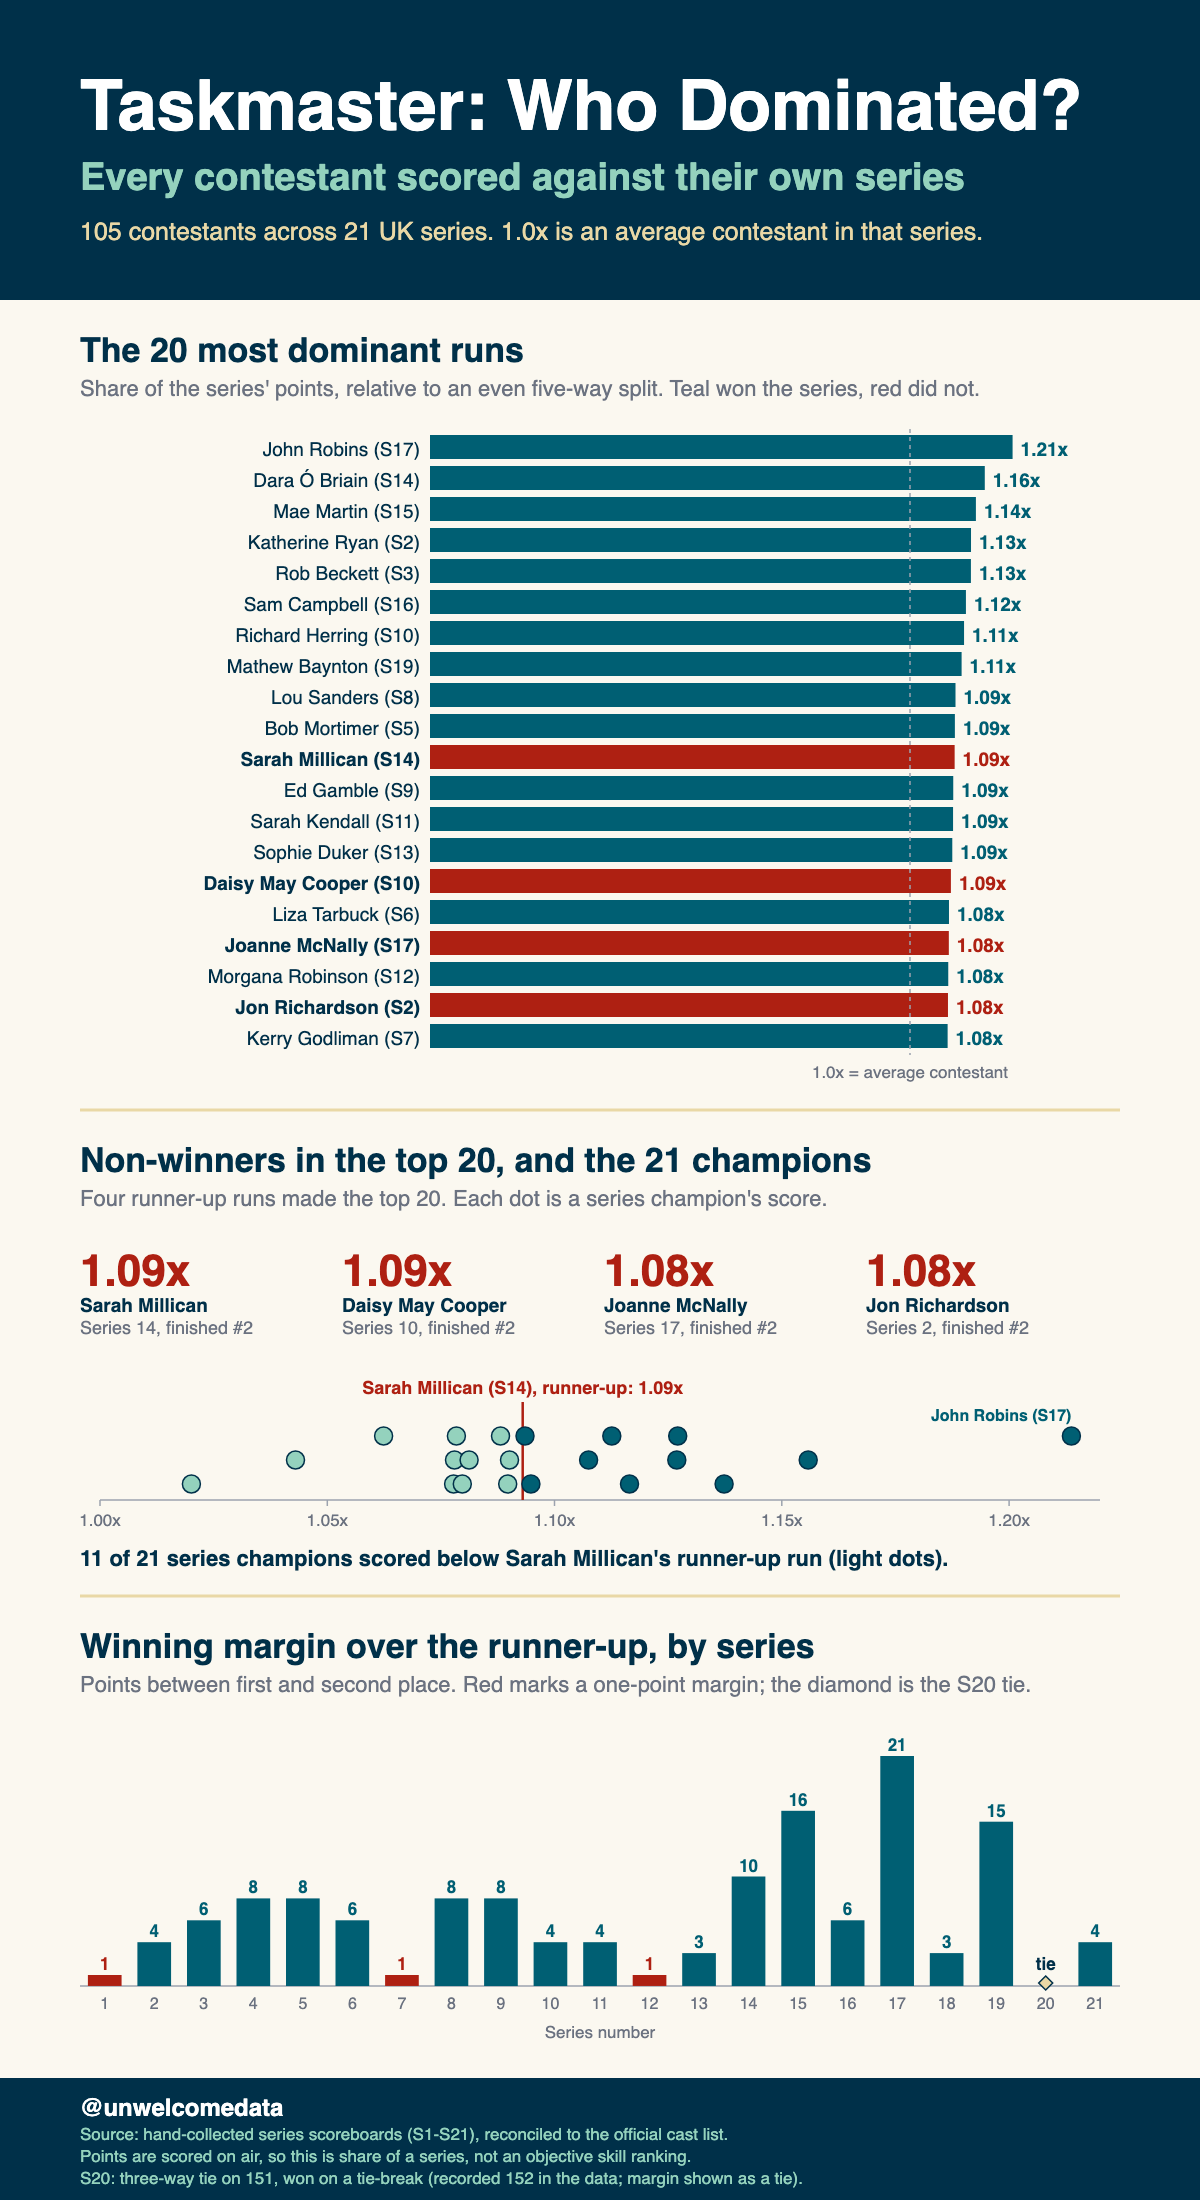
The finding: four contestants posted top-20 all-time runs and still didn’t win their series — they just happened to land in a stacked cast. Sarah Millican’s runner-up run in Series 14 out-scored 11 of the 21 actual series champions.
The charts
Every value is share of series points vs an even five-way split — 1.0 = an exactly average contestant that series (see How it was measured). Click any chart to open it at full resolution.
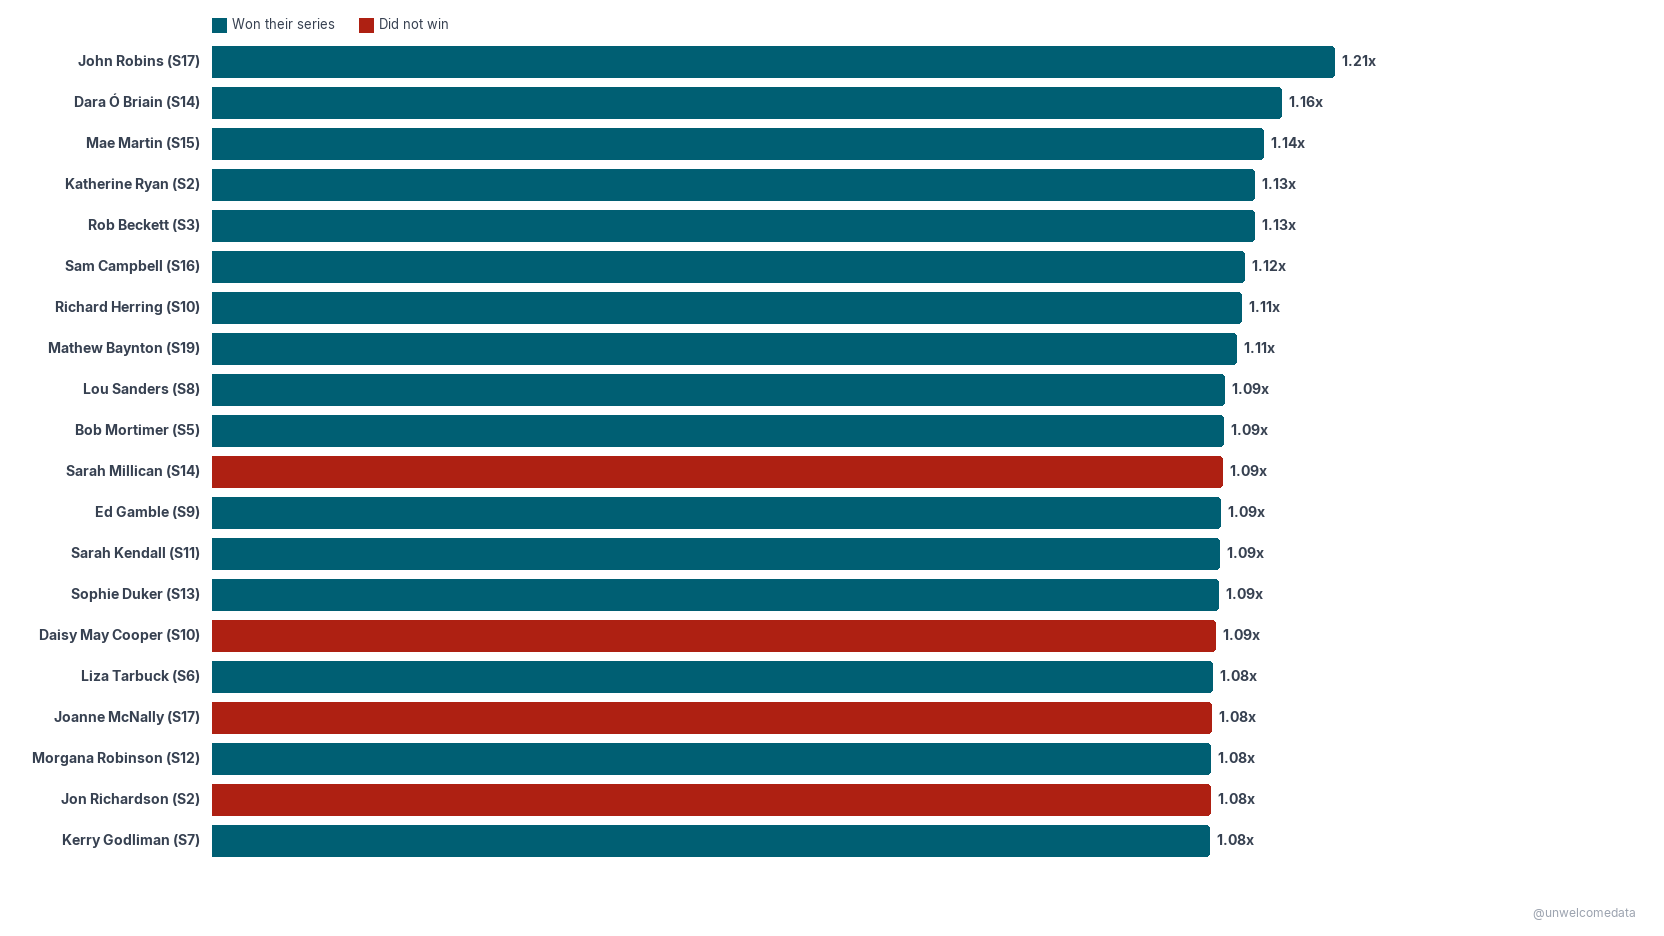
The 20 most dominant runs — share of series points vs an even split (1.0 = average). Teal = won their series, red = didn’t. Four red bars crack the all-time top 20.
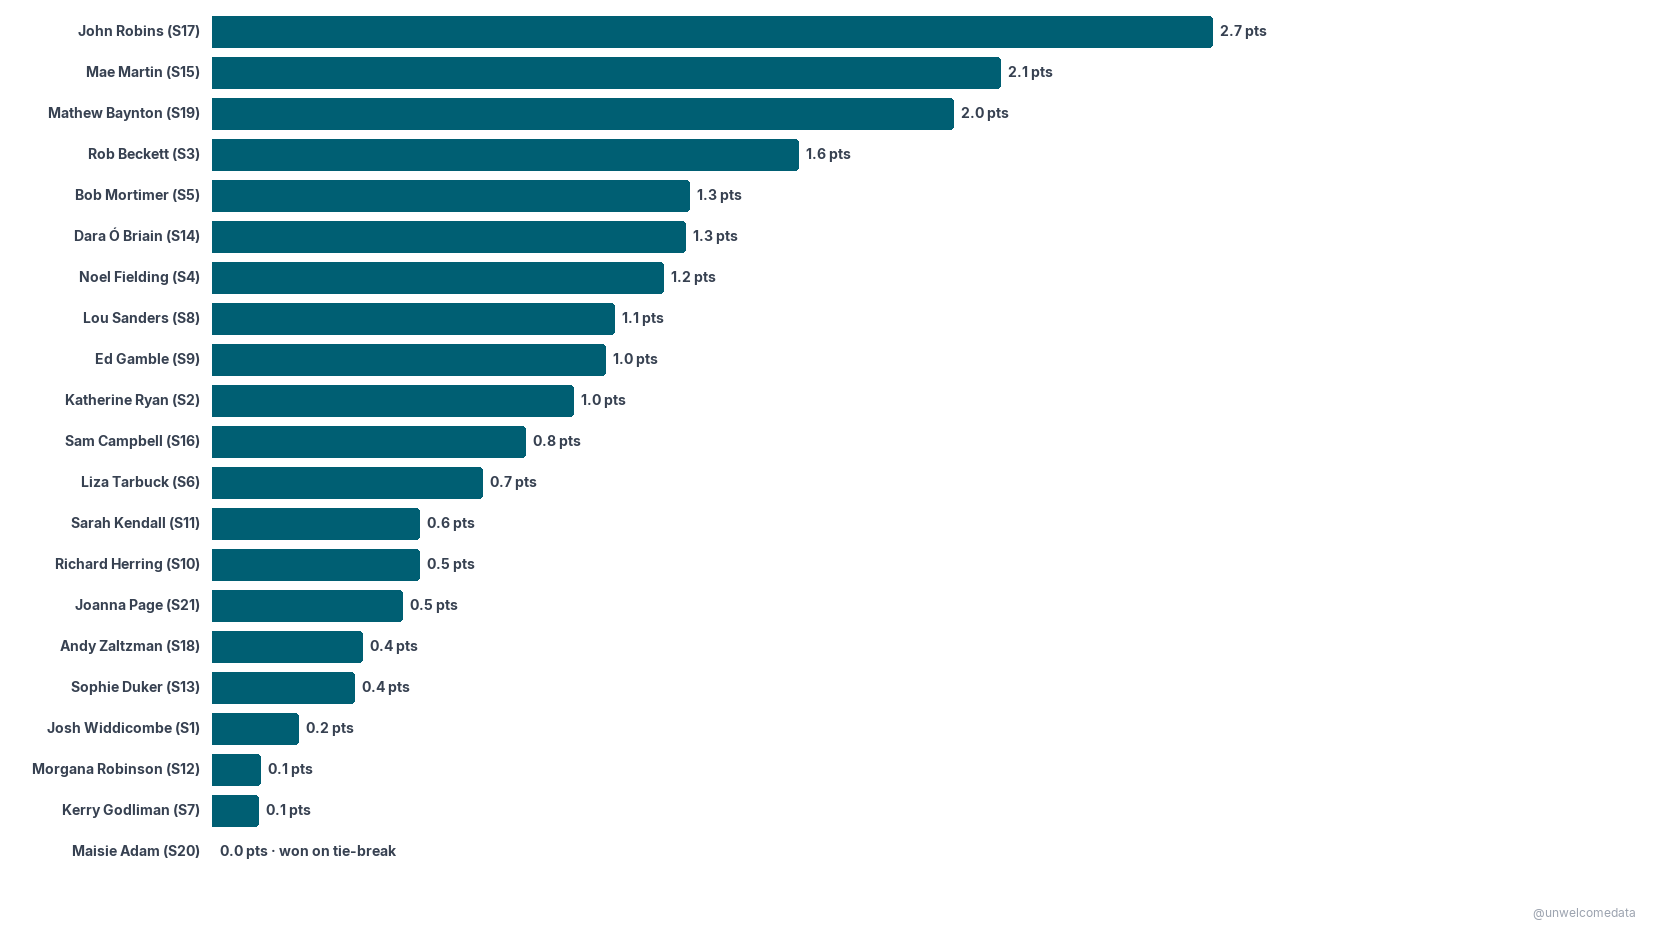
Runaways and nail-biters — every winner’s margin over the runner-up, in share of points. John Robins (S17) ran away with it; three series came down to a single point.
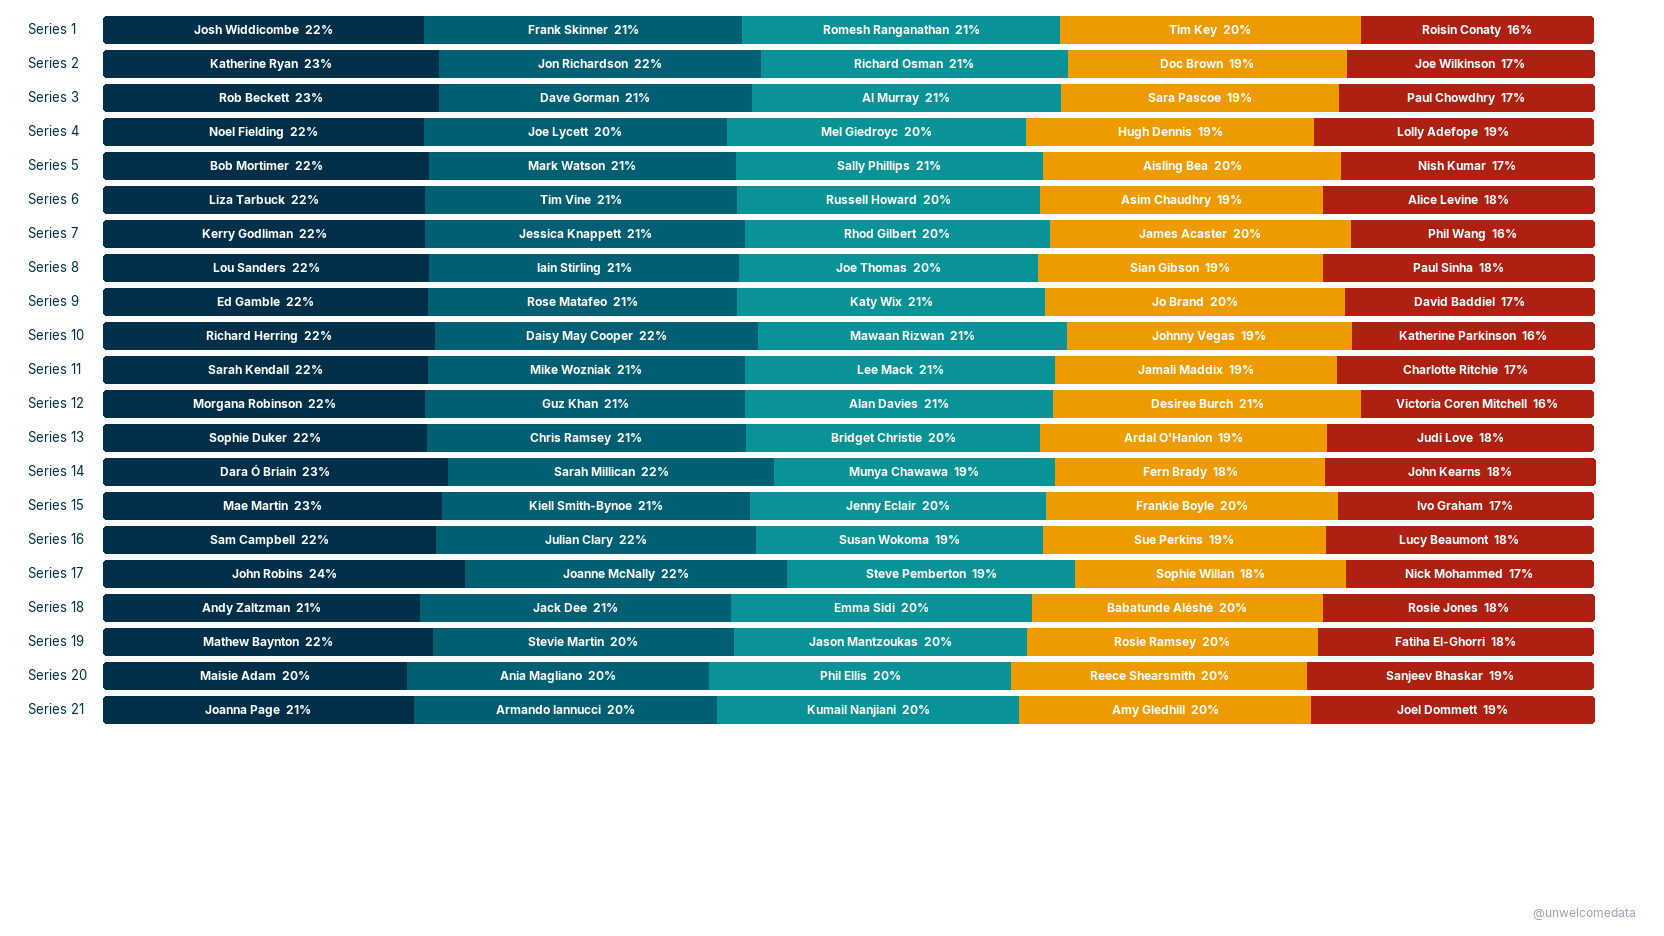
Every series, split by share — each series’ points (100%) divided among its five contestants, so you can see how lopsided or even each cast was.
All 105 contestants, ranked — the full field by share of series points, with the 1.0 line marking an average contestant. Winners in teal, non-winners in red.
How it was measured
The key metric is share of series points relative to an even split
(share_vs_equal in the data):
- Each contestant’s points ÷ their series’ total points = their share of that series.
- Divided by an even five-way split, so 1.0 = an exactly average contestant that series, above 1.0 = above average, below = below.
This normalizes for the differing series lengths that make raw totals misleading.
Honest limit: share-of-series still isn’t perfectly equal across series — task counts and points-per-task vary a bit from series to series. It’s far closer to apples-to-apples than raw totals, but Taskmaster points are a subjective, comedic score awarded on-air, not an objective performance measure. Treat this as “who dominated their own series,” not a definitive skill ranking.
The data
The full dataset is in export/:
taskmaster_contestant_metrics_v1.csv— 105 contestants × 12 columns (raw totals, series share, normalized score, within-series rank, winner flag, margin to winner).taskmaster_contestant_metrics_v1_codebook.md— plain-English description of every column.
Sources & license
Full attribution is in SOURCES.md. In short:
- Points: hand-collected from the Taskmaster UK on-air scoreboards (series finales), cross-checked against the Taskmaster Fandom per-episode statistics and Digital Spy. Scores are facts and aren’t copyrightable; the compiled dataset is released by the author.
- Names: contestant full names verified against the show’s broadcast credits.
Two documented data decisions: an OCR digit misread was corrected (S10 Katherine Parkinson, 148 → 118), and the Series 20 three-way tie — which Maisie Adam won on a live tie-break — is recorded so Adam is the sole winner. Both are explained in SOURCES.md.
License: dataset released as facts (not copyrightable); see SOURCES.md for details.
A few things that stood out
- John Robins (S17) is the most dominant run in the show’s history (1.21× an average contestant), and also the biggest runaway win — 21 points clear of the runner-up.
- Series 20 was the tightest finish ever: a genuine three-way tie at 151 points, settled by a live tie-breaker.
- Four beloved runners-up — Sarah Millican (S14), Daisy May Cooper (S10), Joanne McNally (S17), Jon Richardson (S2) — had top-20 all-time runs without winning.
AI-Assisted Development This project was built with the assistance of Kiro, an AI-powered development environment. All data-sourcing decisions, methodology choices, and published findings are the responsibility of the author. AI was used for code generation, data-pipeline construction, and research assistance — not for analysis conclusions or editorial judgment.