@unwelcomedata · data from public sources
Where Americans moved between states — and the income that moved with them
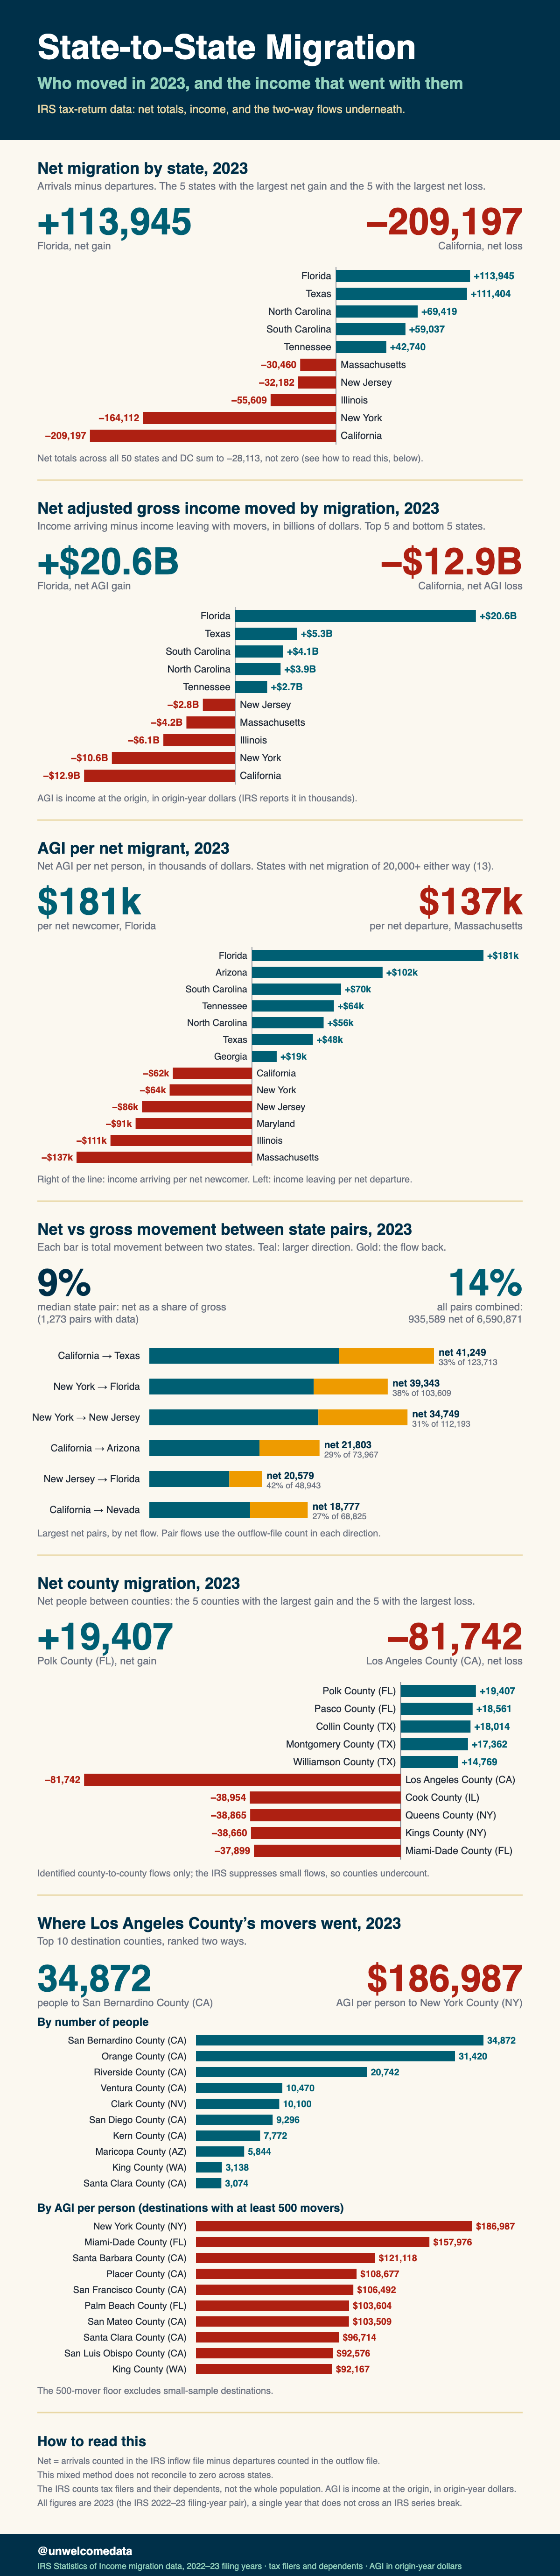
State-to-state migration for 2023, measured two ways at once: who moved (Census ACS survey, people-weighted) and how much income moved with them (IRS tax-return data, income-weighted). Putting both next to each other is the point — they answer different questions and shouldn’t be blended into one number.
The findings that held up:
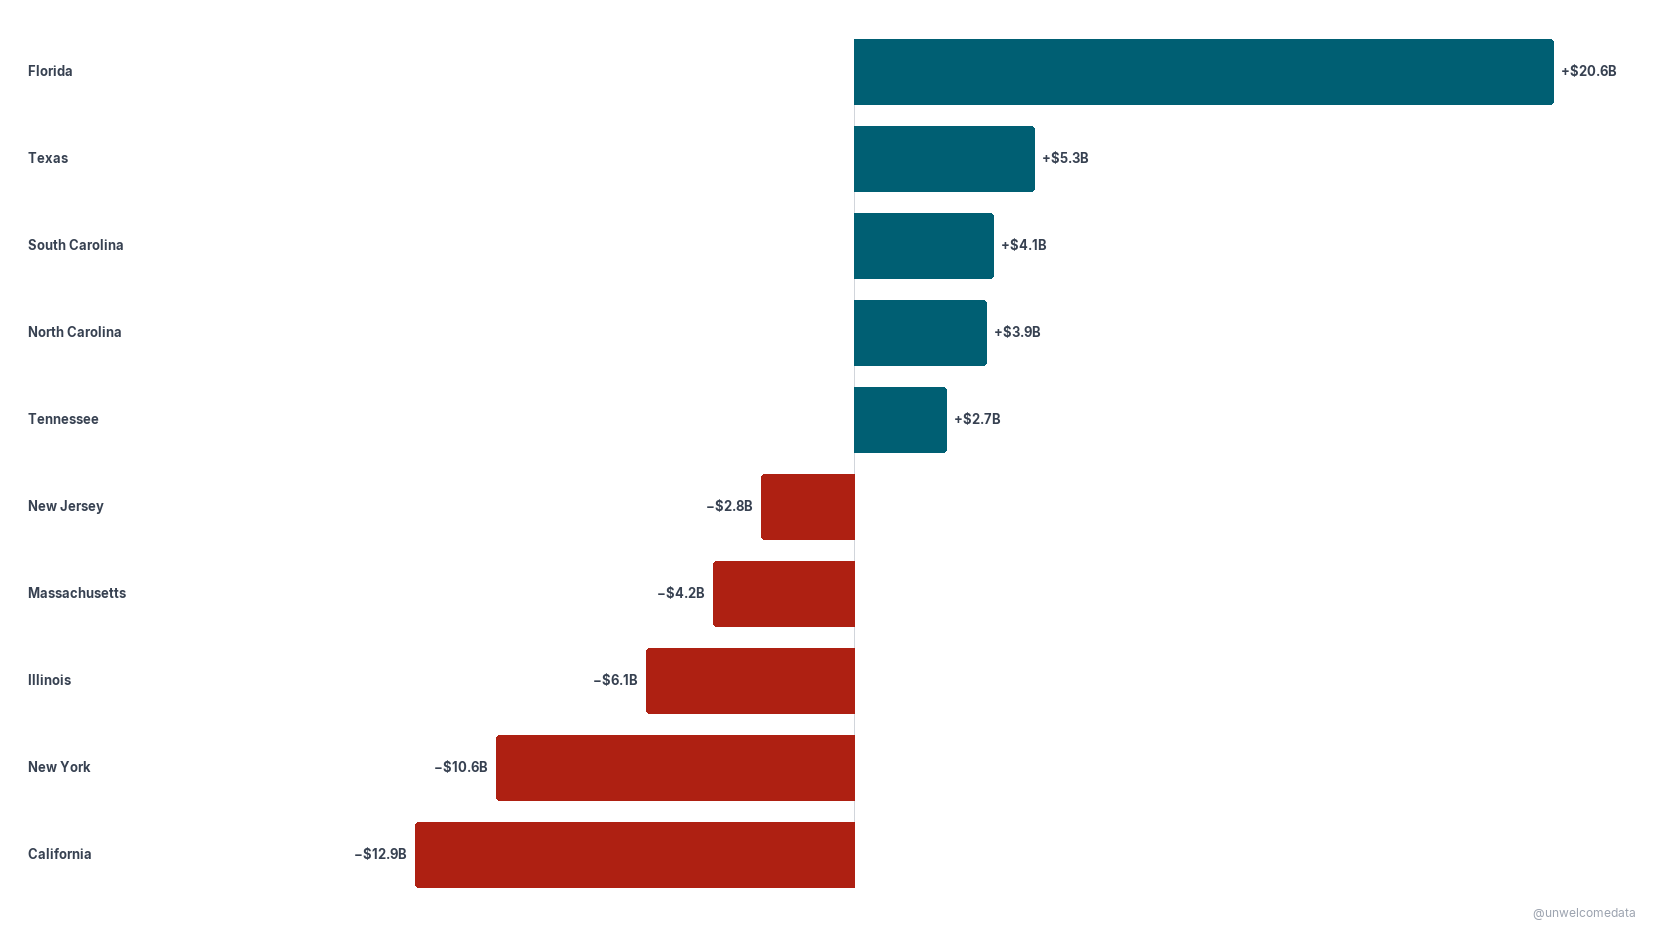
- Florida and Texas gained the most people; California and New York lost the most. Florida also gained the most income, on the order of +$20 billion in adjusted gross income for the year; California and New York each shed north of $10 billion.
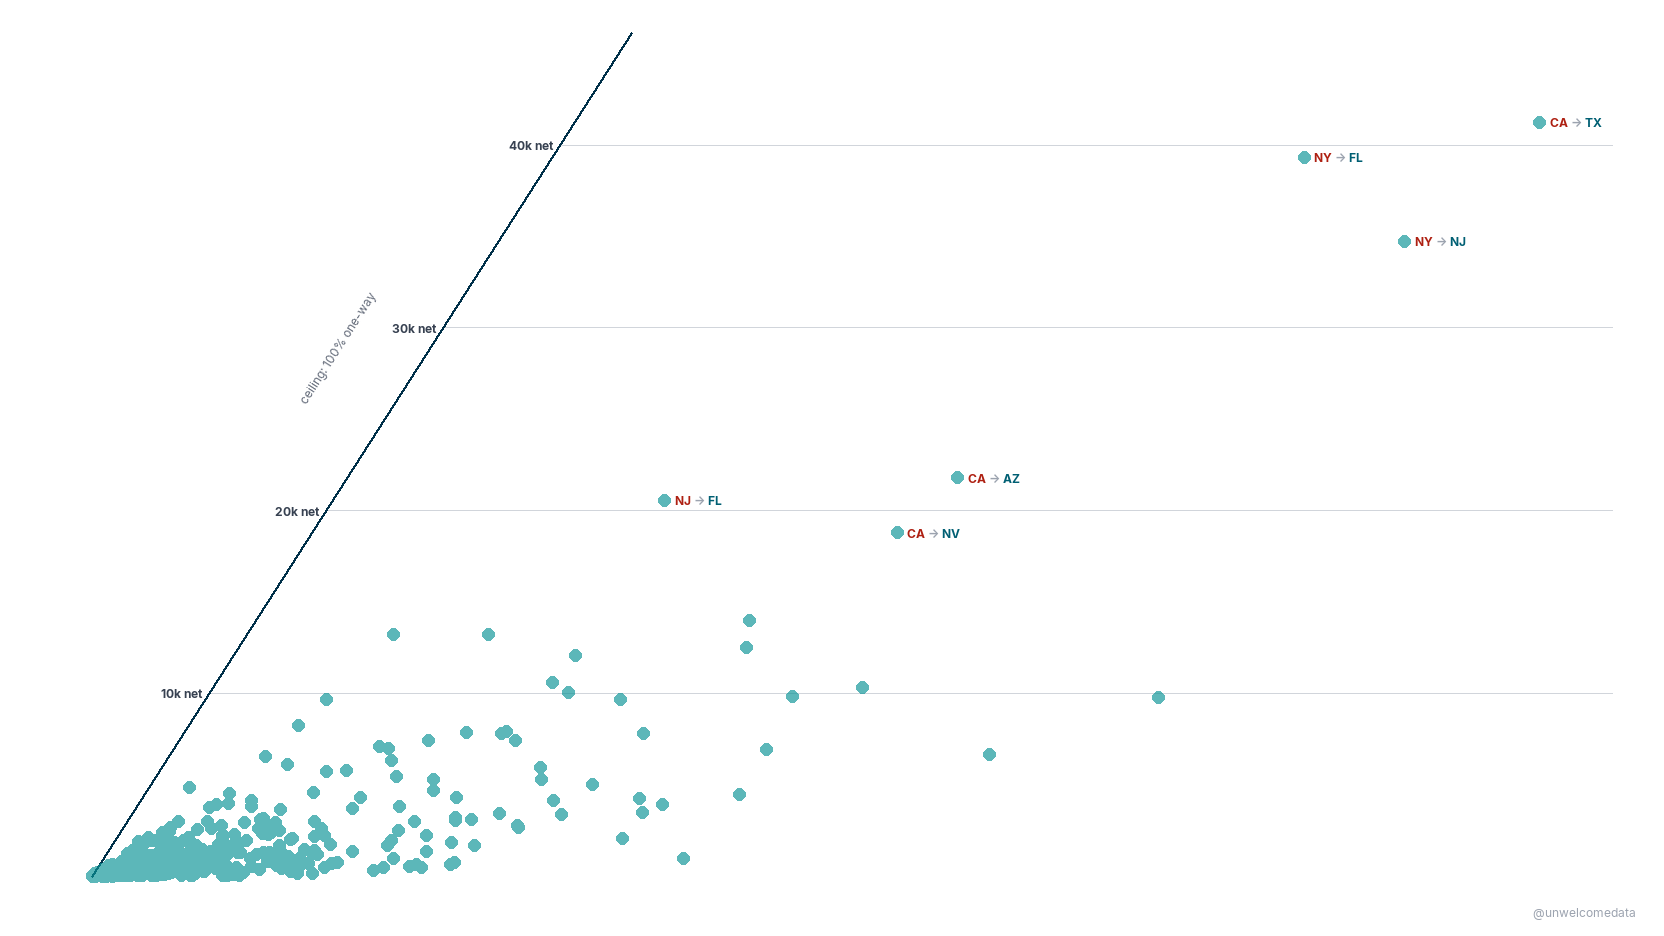
- Most interstate movement cancels out. Roughly nine out of ten moves between states are offset by moves in the opposite direction — the median state’s net migration is only about 9% of its gross churn. The headline “net” numbers ride on top of a much larger two-way flow.
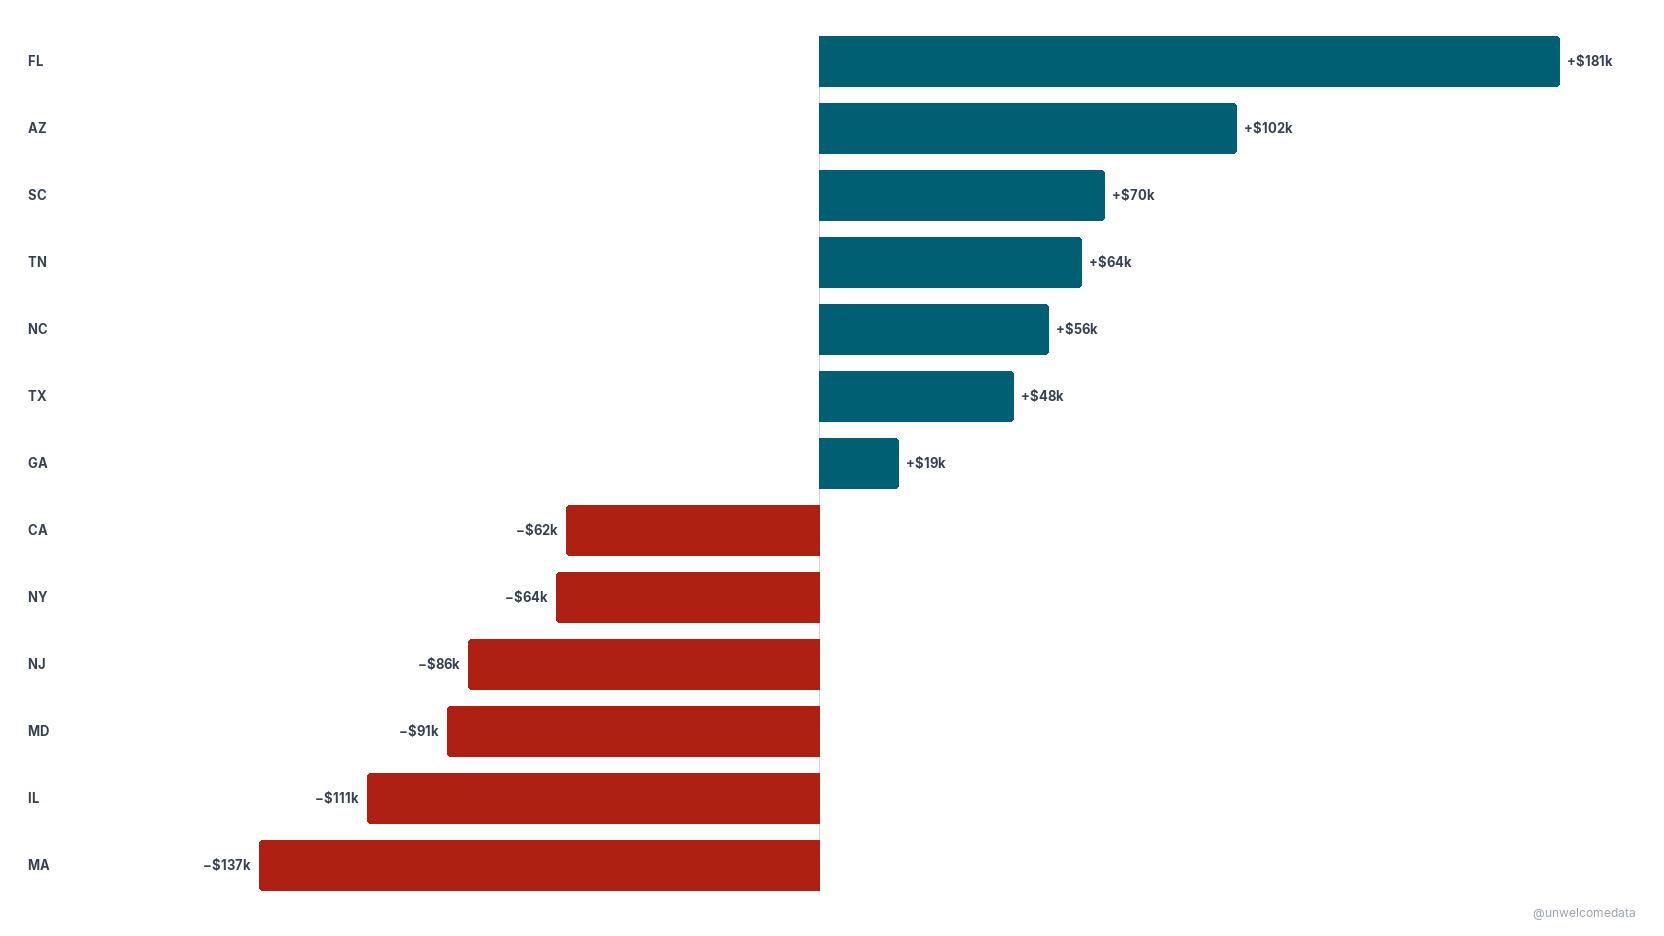
- The income a state gains per net migrant varies enormously. Florida gained roughly $181,000 of AGI per net migrant (high earners moving in); some states lost well over $100,000 per net departure.
The charts
All figures are for 2023, from IRS tax-return data. “Net” = inflow-file arrivals minus outflow-file departures. Click any chart to open it full size.
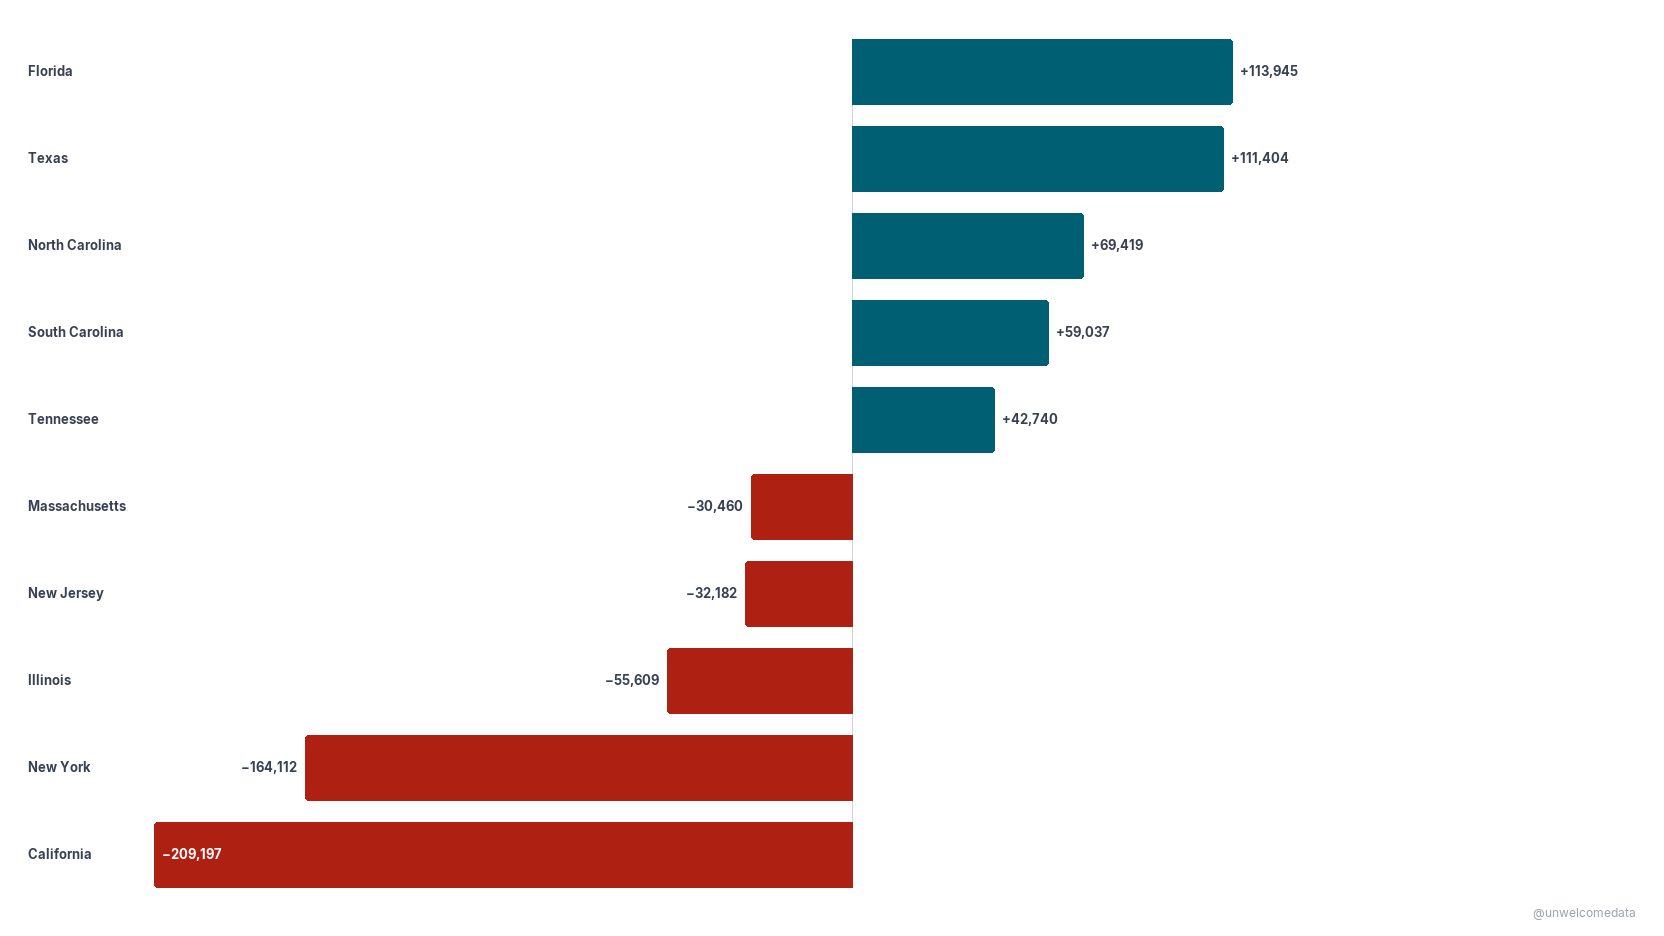
The 5 states gaining the most people — and the 5 losing the most. Net migration in 2023 (arrivals minus departures), trimmed to the 10 extremes.
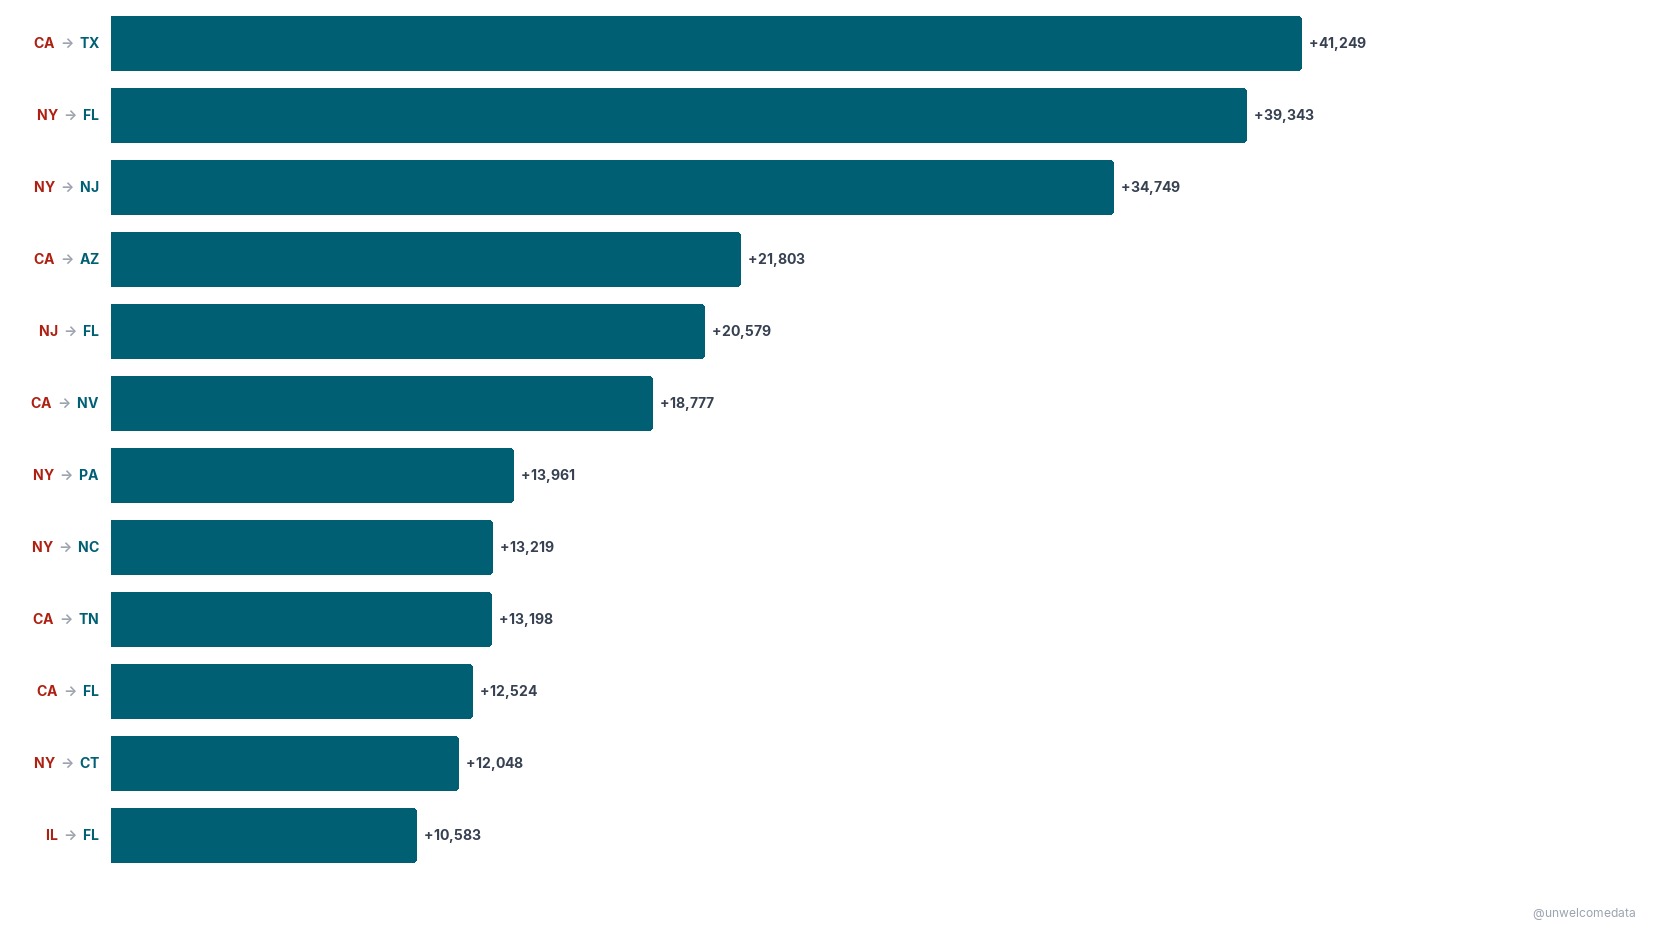
The biggest one-way moves between states, 2023. The largest net directed pairs — the red state lost people to the blue state.
The states gaining — and losing — the most income to migration. Net adjusted gross income moved with migrants in 2023, in billions of dollars (IRS AGI, origin-year dollars).
The average income of the people each state gains and loses. Net AGI per net migrant in 2023, in thousands of dollars per person — right: income arriving per net newcomer; left: income leaving per net departure. States with net migration of at least 20,000 people.
Most interstate moves cancel each other out. Each dot is a state pair, net migration against gross (total) churn. A pair can never have more net than total migration, so the diagonal is a ceiling almost no pair reaches.
Down to the county
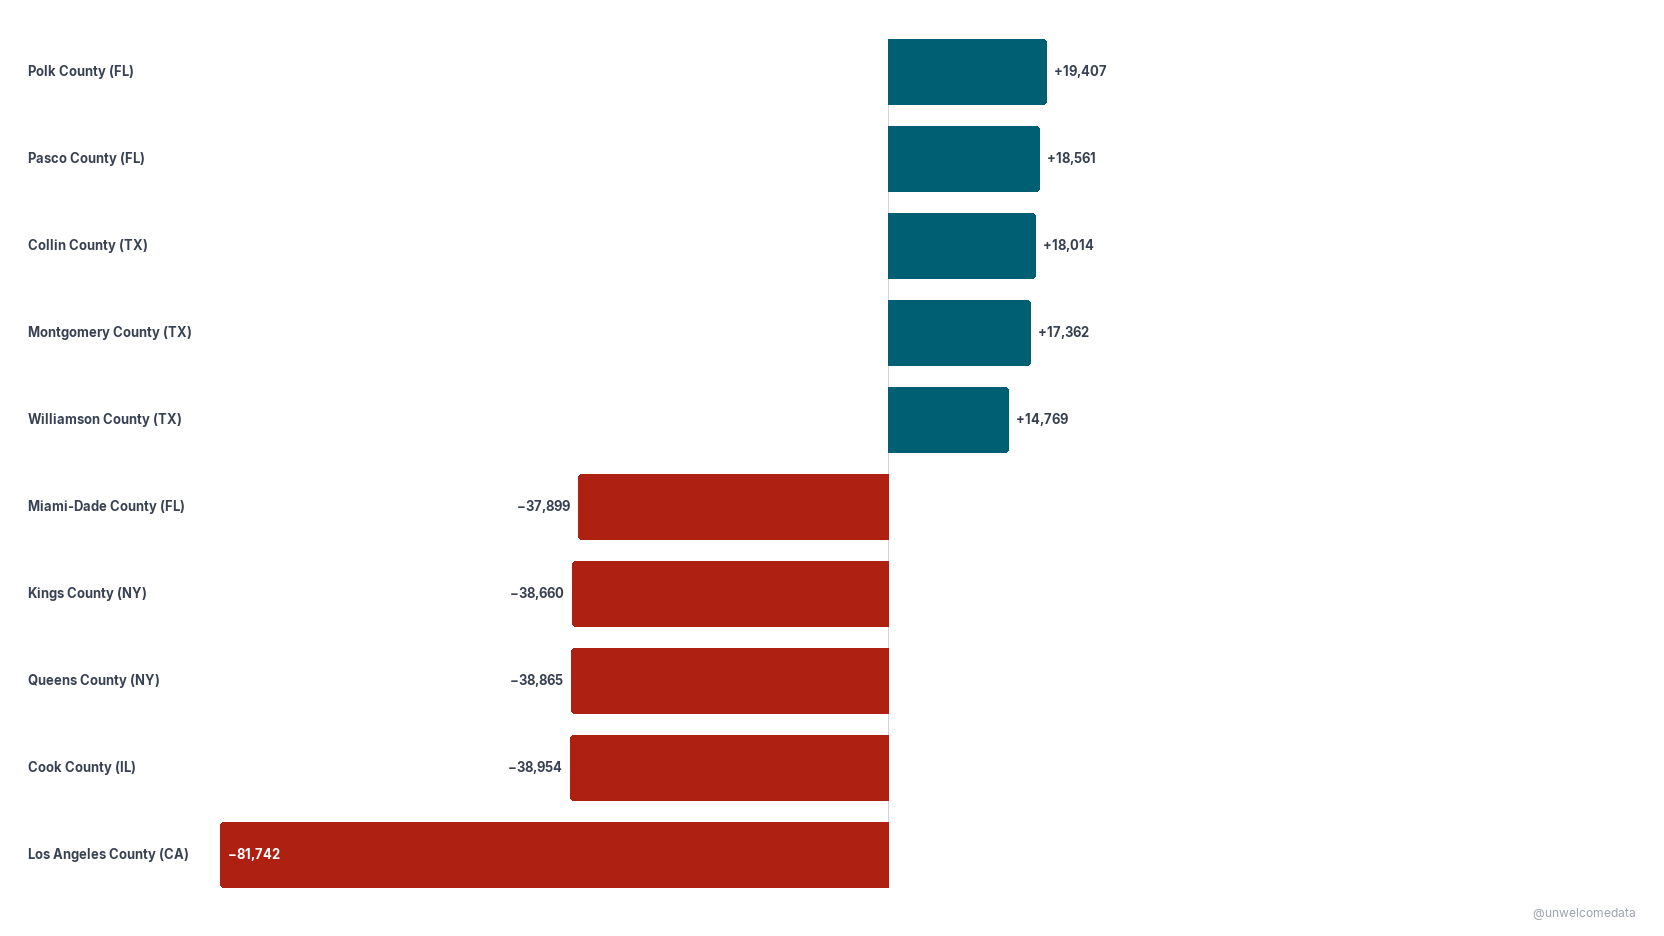
The same IRS tax-return data also tracks moves county-to-county. These two charts are 2023, use IRS county-to-county identified flows only (small flows are suppressed by the IRS, so counties undercount by design), and net = inflow-file arrivals minus outflow-file departures.
County migration — the biggest gainers and losers. Net moves of people between counties in 2023 (top 5 gaining counties, bottom 5 losing). The counties losing the most are big urban cores — Los Angeles (−81,742), Cook/Chicago, Queens, Kings/Brooklyn, Miami-Dade — and the ones gaining the most are sunbelt suburbs in Florida and Texas (Polk, Pasco, Collin, Montgomery, Williamson).
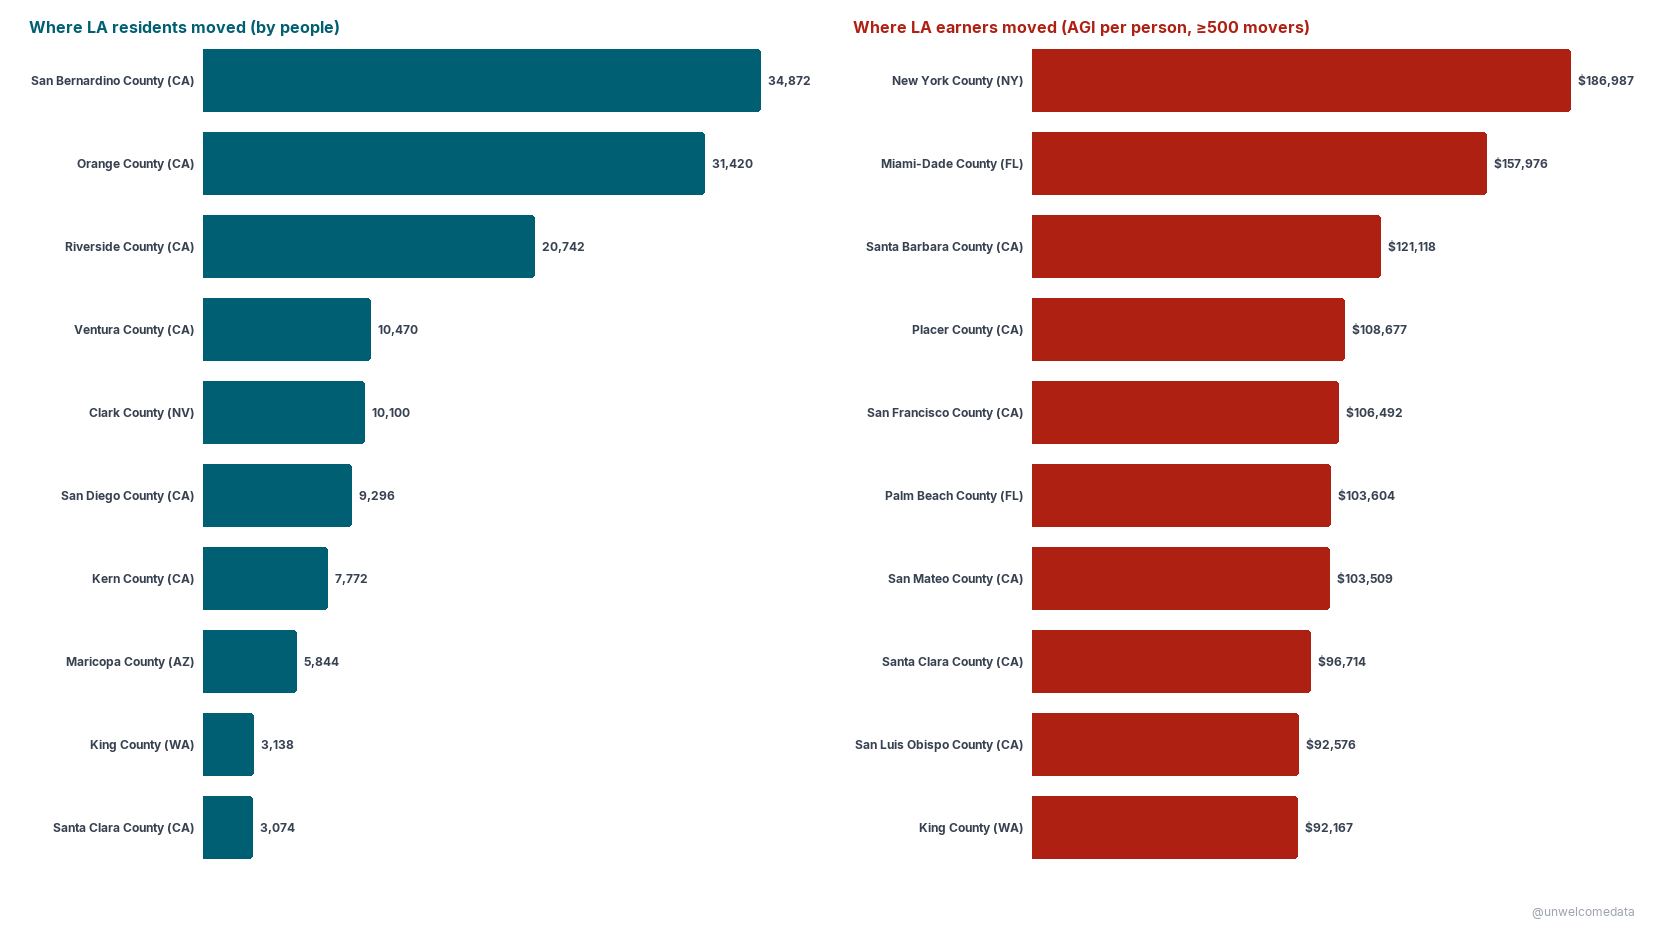
Los Angeles County’s two migrations. LA is the biggest single loser, so it gets a closer look — the top 10 destination counties, two ways. Left: by number of people — the volume goes to LA’s own cheaper inland ring (San Bernardino 34,872, Orange, Riverside). Right: by AGI per person (limited to destinations with at least 500 movers, to exclude tiny-sample resort counties) — the highest earners leave for other elite metros (Manhattan ≈ $186,987 of AGI per person, Miami-Dade, Santa Barbara, San Francisco). The headcount and the money go to different places.
How it was measured
Two federal sources, kept side by side rather than merged:
- IRS Statistics of Income (SOI) — built from tax returns. A change of state between two filing years counts as a move. It’s income-weighted (it carries AGI) but its universe is tax filers and their dependents, not everyone.
- Census ACS — a survey (“where did you live one year ago?”). It’s people-weighted and captures everyone regardless of tax status, but every estimate carries a margin of error, and small flows are unreliable.
The two correlate strongly (Pearson r ≈ 0.86) but measure different universes, so the dataset reports both columns and never reconciles them to a single figure.
Caveats that materially affect interpretation:
- “Net” here uses the IRS convention (arrivals from the inflow file minus departures from the outflow file). It’s the more legible story, but it doesn’t reconcile to exactly zero across all states (a residual on the order of tens of thousands, from a few one-sided edges). Stated plainly so the totals aren’t over-read.
- IRS counts filers + dependents, not total population, and its AGI is income at the origin, in that year’s thousands of dollars — it’s not the mover’s later earnings.
- The published data spans 2011–2024, but this release’s story is the 2023 single year. IRS has methodology series breaks at 2011–12 and 2022–23, and ACS has no 2020 release and a known 2022 Connecticut error — so any multi-year comparison must carry those caveats. 2023 alone crosses none of them.
- The county charts are a single-year (2023) snapshot of identified flows. IRS suppresses small county-to-county flows, so the identified edges undercount real movement (nationally they capture a majority of it, not all), and a county’s “net” is the sum of its identified edges only. The county income class used elsewhere in the data describes the place (a county’s resident AGI-per-return vs the national median), not the income of the individual movers.
Per-source collection methods, definitions, series breaks, and the full column glossary are in SOURCES.md.
The data
The published dataset is in export/:
state_migration_flows_v1.csv— directed state-to-state flows with both the IRS (returns, individuals, AGI in/out) and ACS (migrants, margin of error) measures side by side, 2011–2024.state_migration_flows_v1_codebook.md— a plain-English description of every column.county_migration_flows_v1.csv— directed county-to-county flows for 2023, each endpoint tagged with its income class (above/below the national median county AGI-per-return), with the IRS returns / individuals / AGI measures. This is the data behind the two county charts above.county_migration_flows_v1_codebook.md— a plain-English description of every county column.
The richer packaging (Excel, Parquet) and the full pipeline code are in the repo.
Reproduce it
The published dataset rebuilds from raw sources with one command:
python scripts/reproduce.py
It runs the full pipeline — ingest → load → clean → prepare — using the same
logic the project uses throughout (in src/: ingest.py,
clean_quality.py, prepare.py). On the first run it downloads the IRS SOI state
CSVs and the Census ACS migration tables (the URLs are in SOURCES.md)
into data/raw/; after that it runs offline. The output CSV is byte-for-byte
identical to the published export/state_migration_flows_v1.csv. See
scripts/README.md for options and the stage-by-stage
breakdown.
For exploring the built database directly, queries/example_queries.sql
has read-only reference queries (table list, provenance, top net gainers/losers,
income-per-migrant).
(This reproduces the state-level flows dataset. The county-to-county layer is
built through the same src/ pipeline from the IRS county files; the published
county_migration_flows_v1.csv is included in export/.)
Sources & license
Full attribution — publisher, URL, collection method, definitions, series breaks, and known controversies — is in SOURCES.md. In short: IRS Statistics of Income migration data and U.S. Census Bureau ACS state-to-state migration flows, both U.S. government works in the public domain. No crowd-edited sources are used.
Further exploration
- A multi-year time series (2011–2024) of net migration, carrying the IRS and ACS series-break caveats — does the Florida/Texas trend accelerate, and where’s the COVID bump?
- Stayers vs. leavers income: do the people leaving a state earn more or less than those who stay?
- A wider county cut — the two county charts here are a single 2023 snapshot for a handful of counties; a multi-county, multi-year county view (metro-level rollups, the affordability-migration pattern over time) is the natural next step.
AI-Assisted Development This project was built with the assistance of Kiro, an AI-powered development environment. All data-sourcing decisions, methodology choices, and published findings are the responsibility of the author. AI was used for code generation, data-pipeline construction, and research assistance — not for analysis conclusions or editorial judgment.