@unwelcomedata · data from public sources Follow for new charts: X · Bluesky
Pokémon stat fingerprints
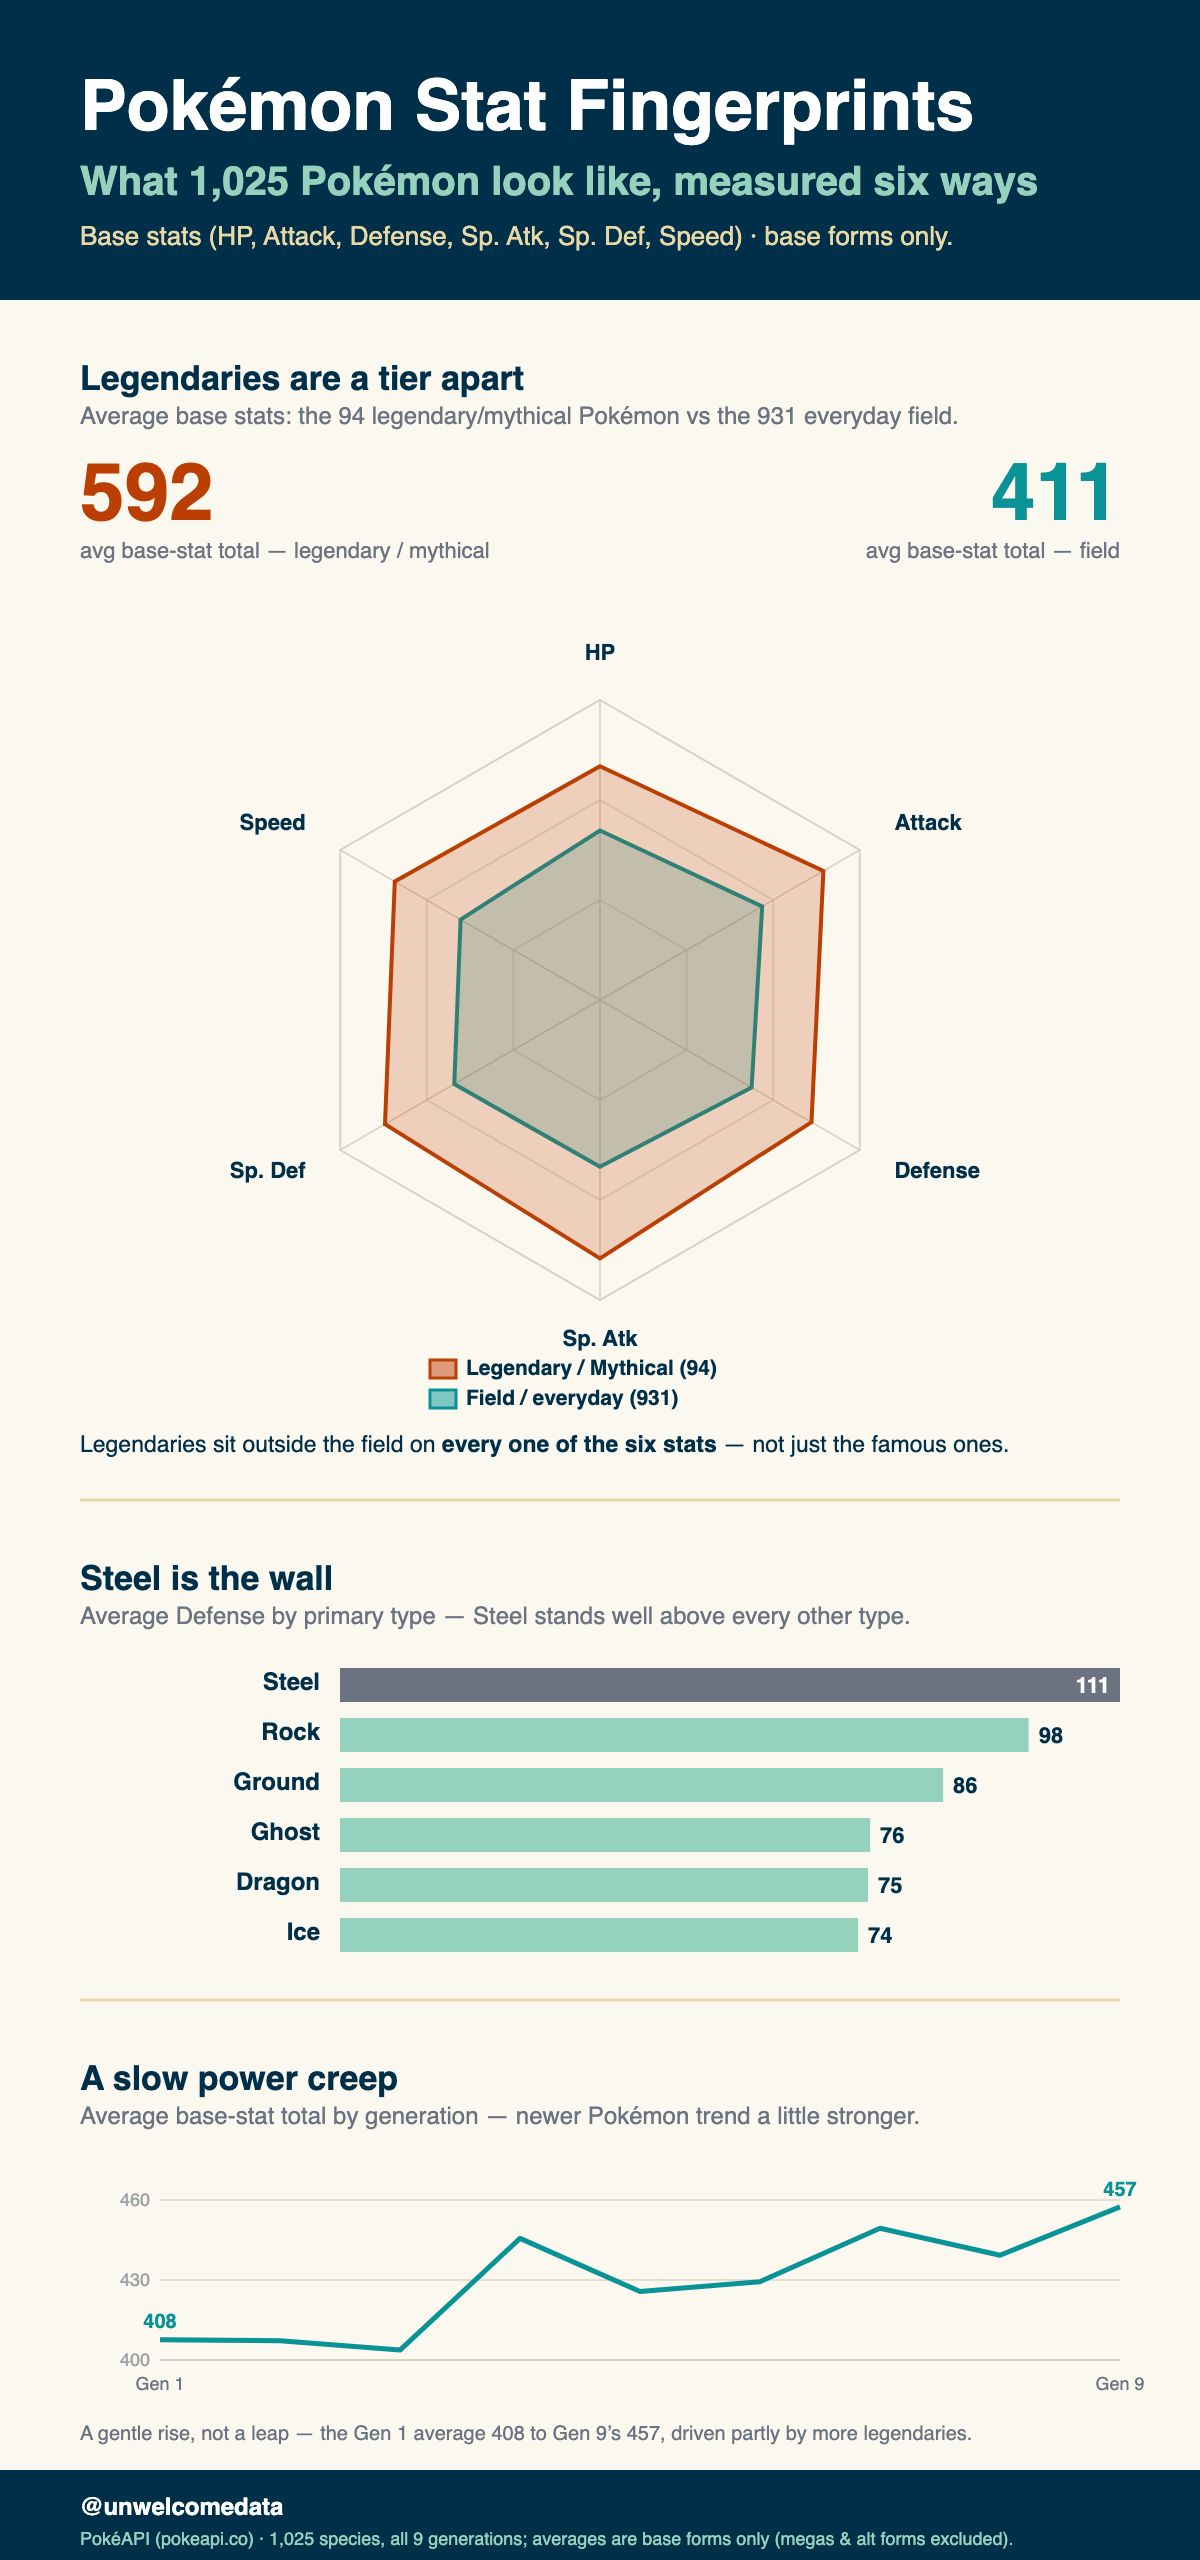
Every Pokémon is just six numbers — HP, Attack, Defense, Sp. Atk, Sp. Def, and Speed. Plot those six on a radar and each one gets a shape: a stat fingerprint. This looks at those fingerprints across 1,025 species (all nine generations, from PokéAPI) — for iconic individuals, for whole types, for each generation, and for legendaries versus everything else.
The findings:
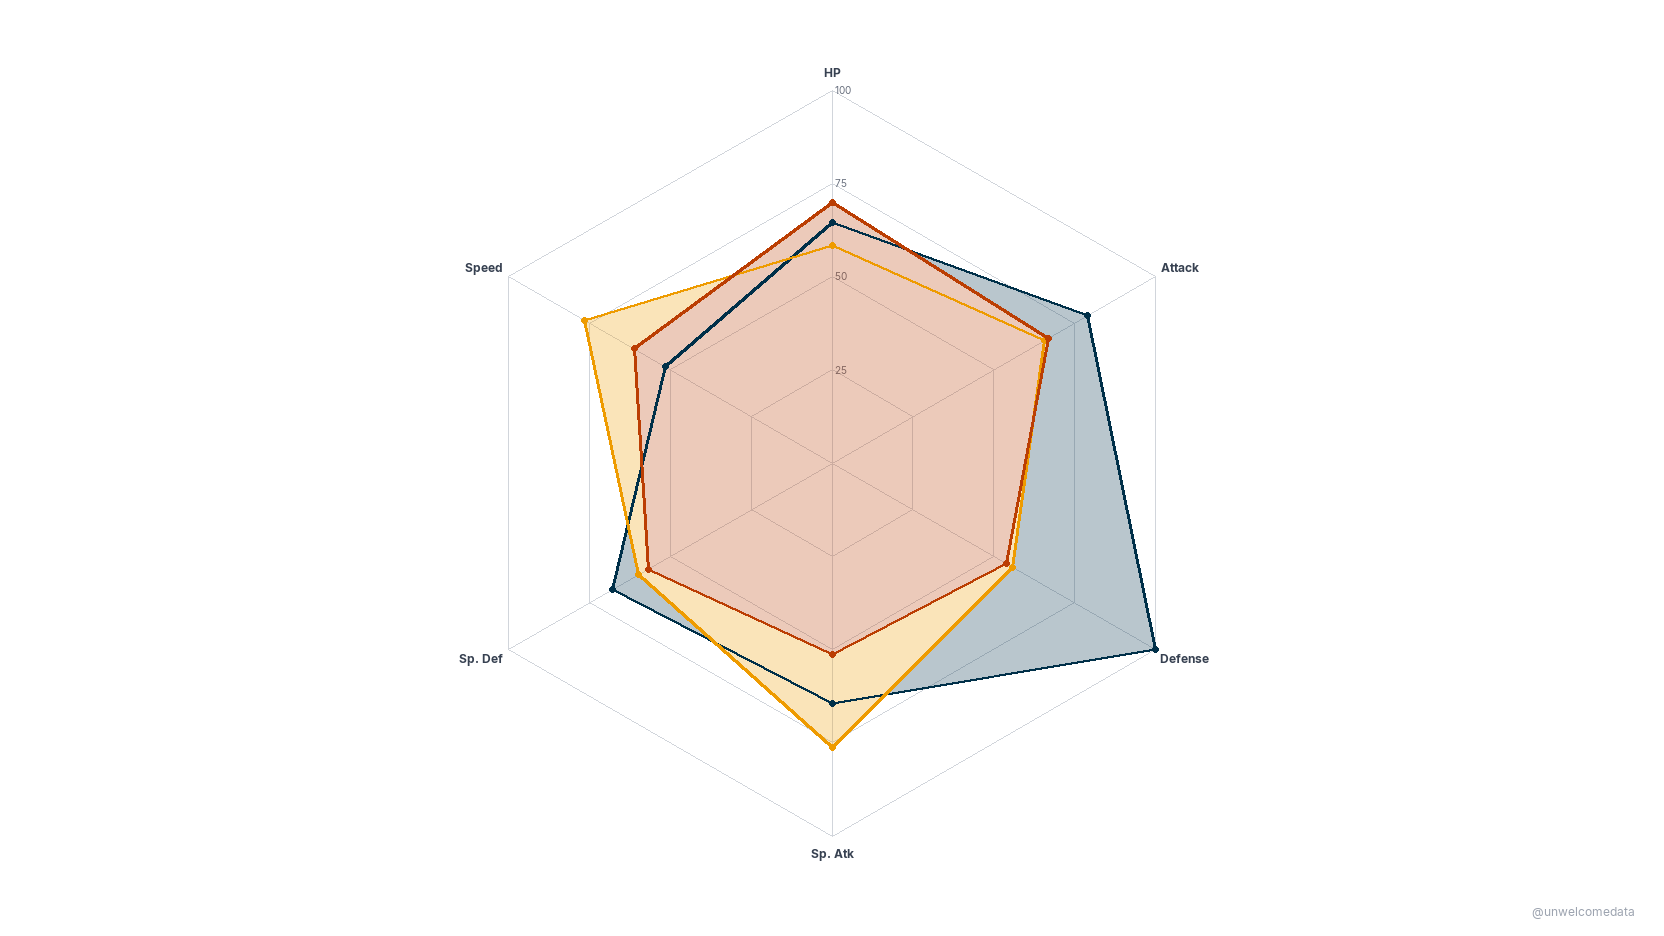
- Steel is the tank. Of all 18 primary types, Steel has the highest average Defense (~111).
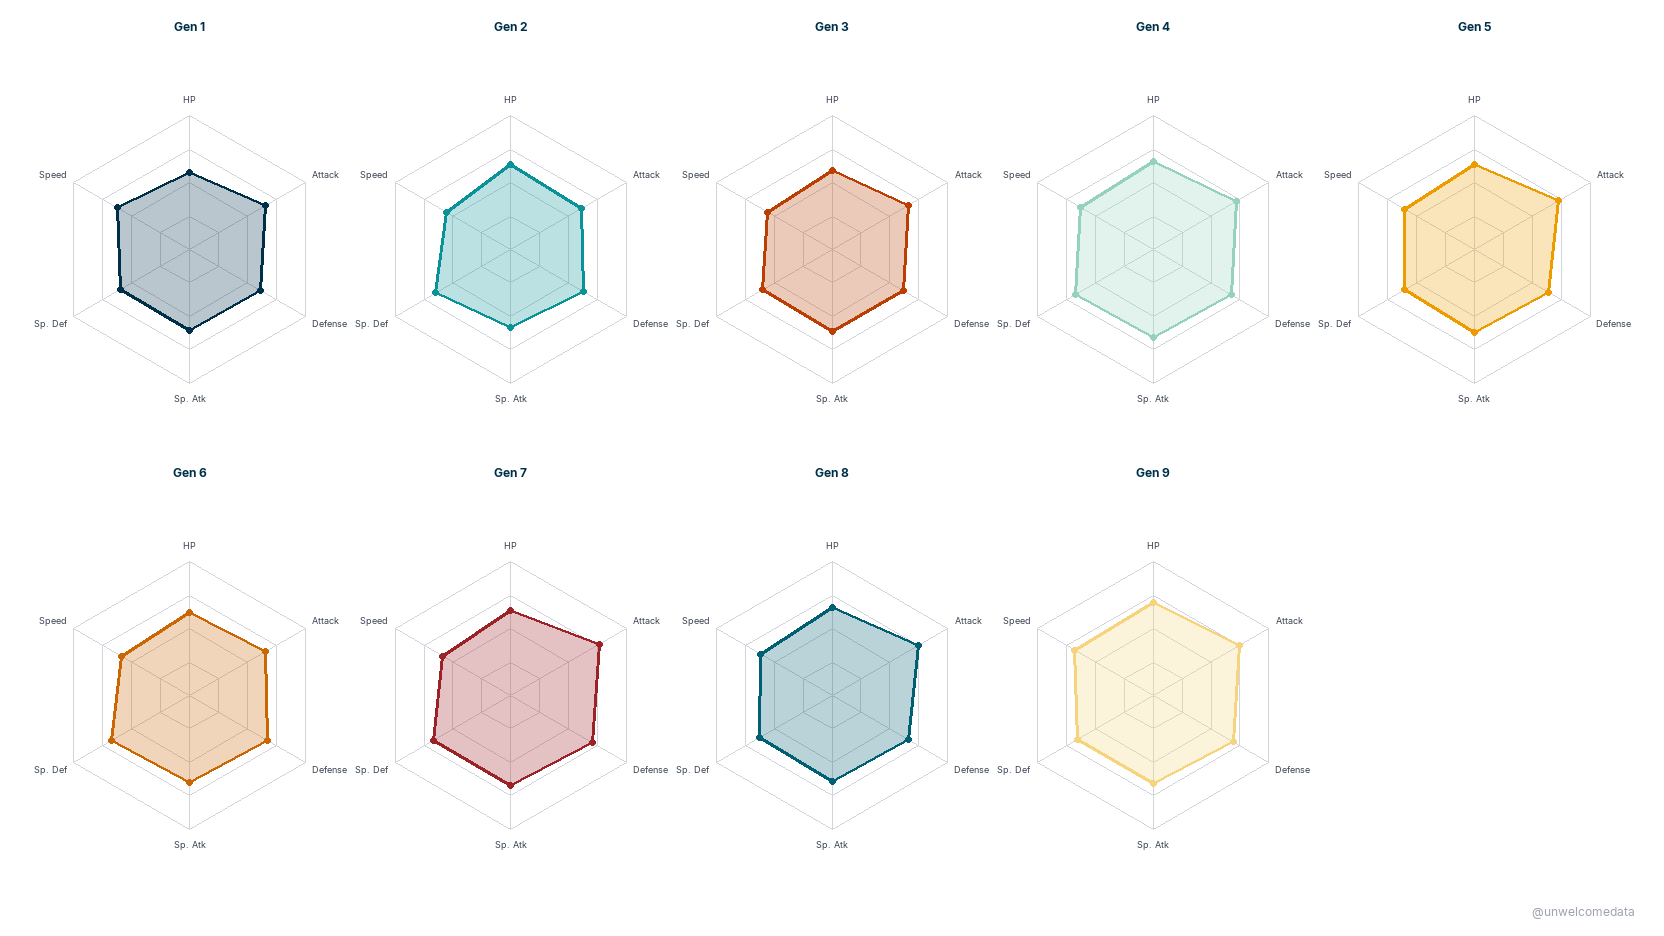
- The games keep getting stronger. Generation 9 species have the highest average base-stat total (457.4 BST) — power creep is real.
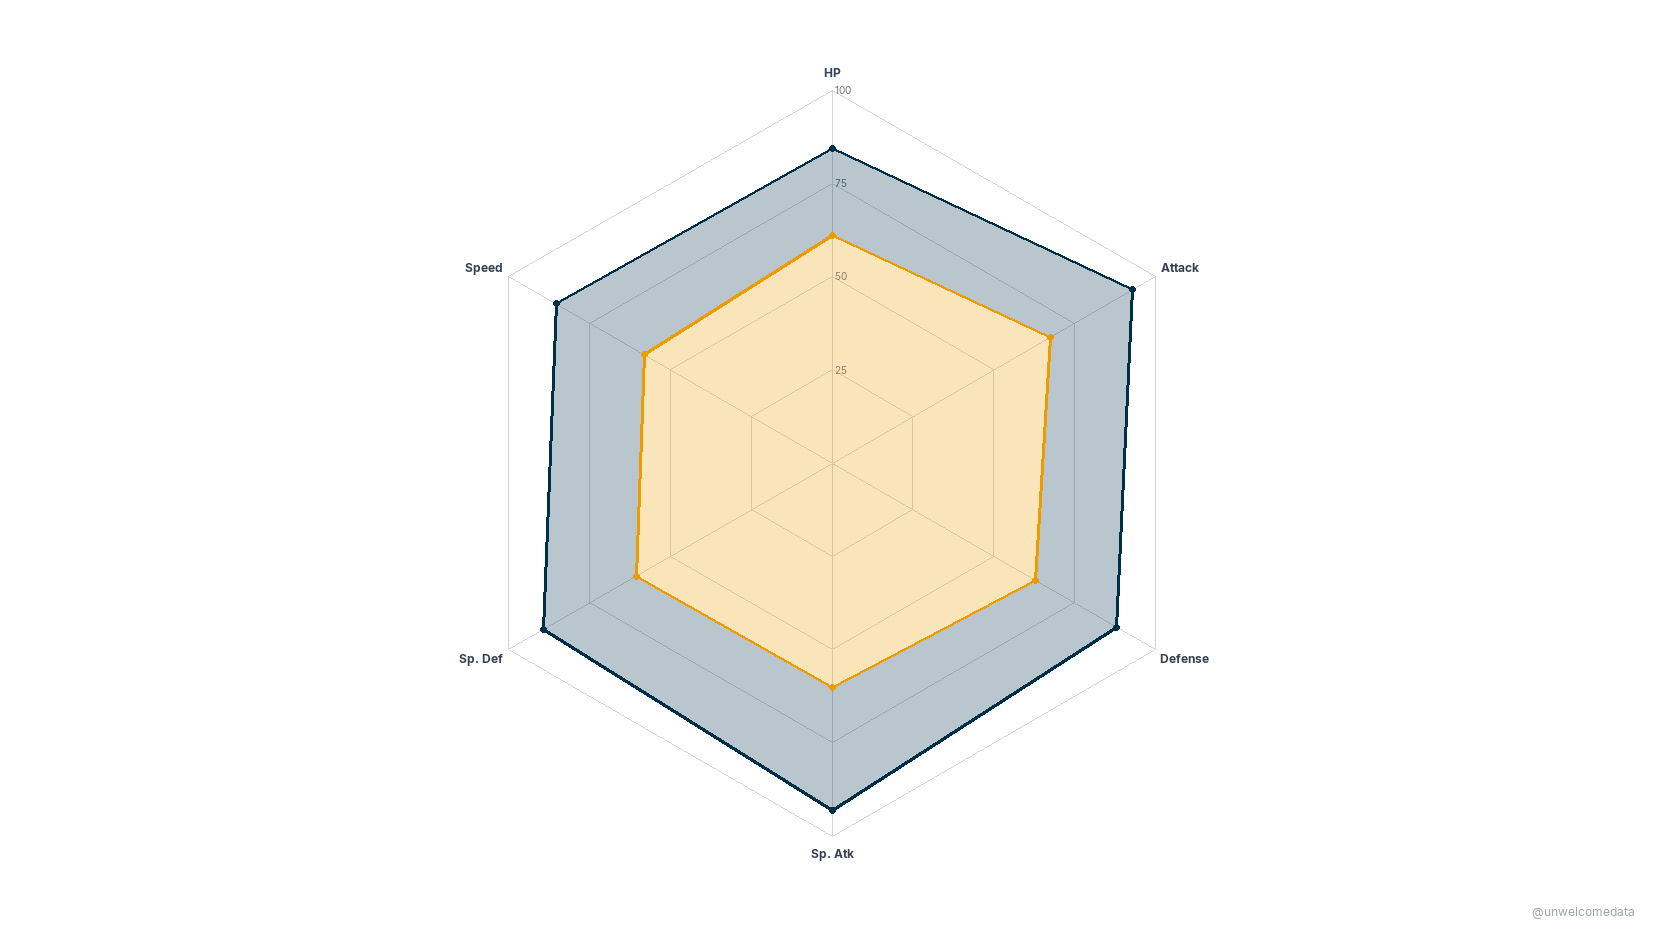
- Legendaries are better at everything. The legendary/mythical group averages 592 BST versus 411 for the ordinary field — and they sit outside the field on every one of the six axes, not just one or two.
- There are 94 legendary/mythical species and 931 ordinary (“field”) species in the set.
Click any chart to open it at full resolution.
1. Iconic stat fingerprints
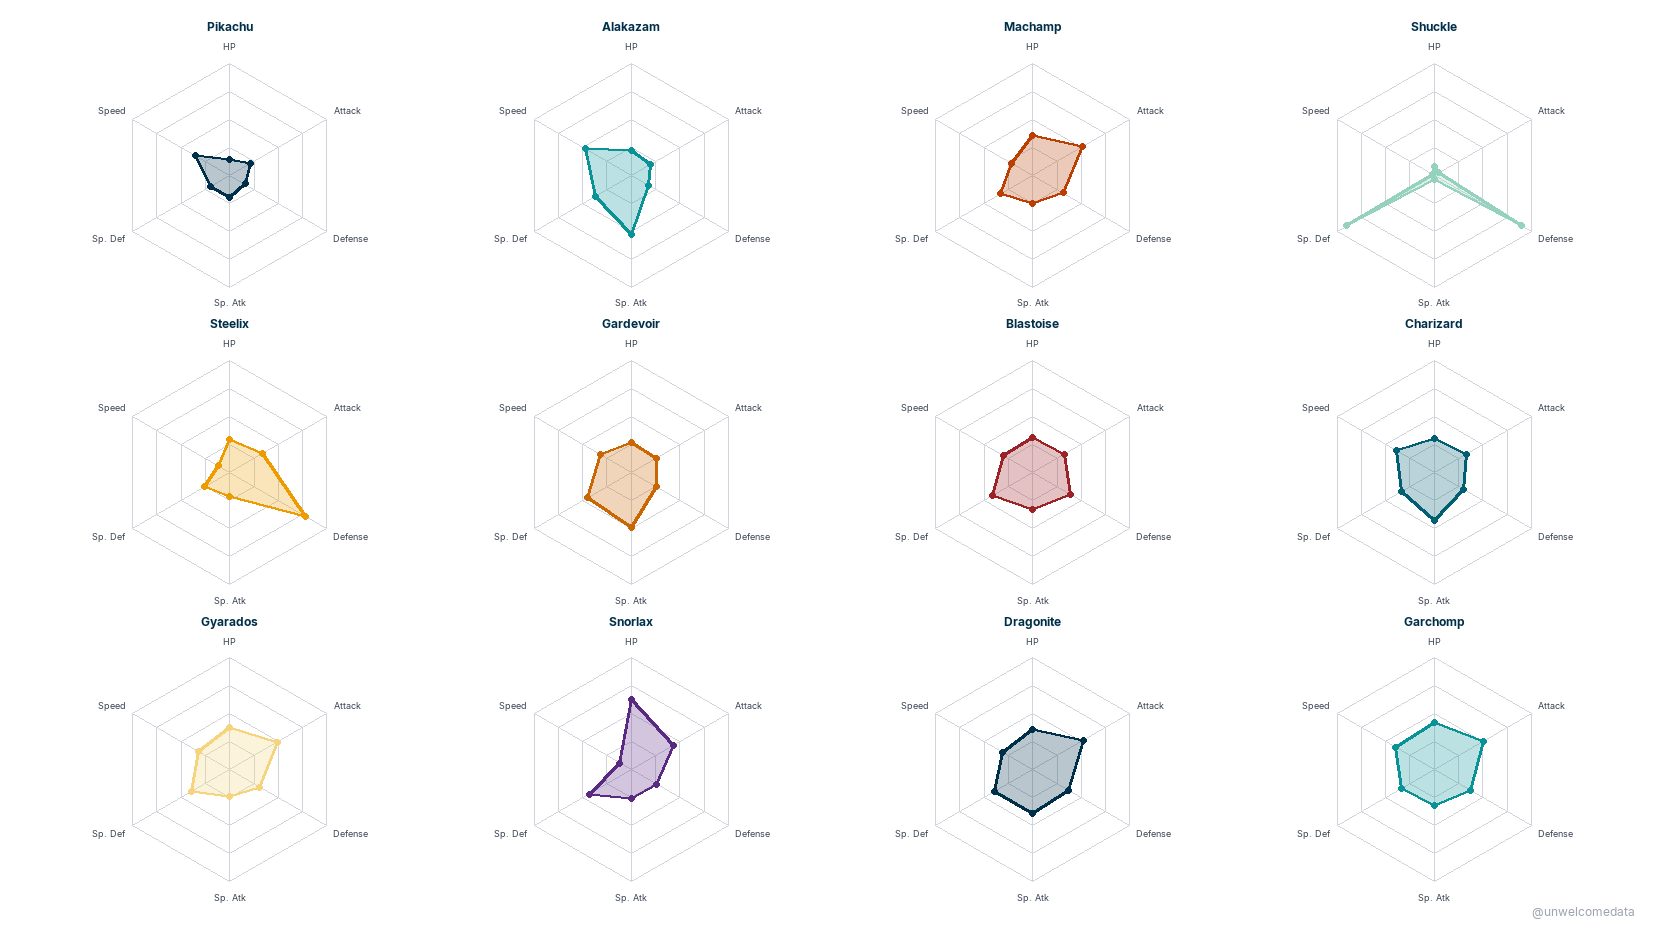
Twelve well-known Pokémon, each drawn as its own radar on the raw 0–255 stat scale, so you can read the archetypes directly: Shuckle’s enormous defensive wall, Alakazam’s glass-cannon spike, Blissey’s wall of HP. These are individual species, not averages.
2. Legendaries vs. the field
One radar overlaying the average legendary/mythical fingerprint against the average of the ordinary field. The legendary shape fully contains the field shape — legendaries are bigger on every axis.
Base forms only. These averages use one canonical base form per species; Mega Evolutions, Gigantamax, regional variants, and alternate/Paradox forms are excluded. That’s why this set’s averages run slightly below form-inclusive fan wikis (e.g. legendary avg ~592 here vs ~626 on Bulbapedia). Scope difference, not an error — see SOURCES.md.
3. Power creep by generation
One radar per generation (I–IX) showing each generation’s average stats. The shapes grow outward over time, with Generation 9 the largest — the newest Pokémon are the strongest on average.
Base forms only — averages exclude megas and alternate forms (see note above and SOURCES.md).
4. Three types, three shapes
One radar overlaying the average fingerprint of three contrasting types: Steel (the defensive wall), Electric (fast and special-leaning), and Normal (the balanced middle). Same six axes, three very different shapes.
Base forms only — averages exclude megas and alternate forms (see note above and SOURCES.md).
Additional charts are available in the repo (docs/) — including a full
18-type facet of average stat fingerprints, one radar per primary type.
How it was measured
Each Pokémon’s six base stats come straight from PokéAPI (the current/latest game values). Chart 1 plots individual species on the raw 0–255 stat scale. Charts 2–4 are averages, normalized so the typical shape fills the radar frame — the comparison is between shapes, so the normalization is shared within each chart and the rankings are unaffected.
The one honest limit worth repeating: everything here is base forms only — one canonical form per species. Mega Evolutions, Gigantamax, regional variants, and Paradox forms are left out, so these averages read a touch lower than encyclopedias that fold those high-stat forms in. The direction of every finding (Steel tankiest, Gen 9 strongest, legendaries above the field everywhere) holds regardless.
The data
The full per-species dataset is published here:
- pokemon_base_stats_v1.csv — 1,025 species × 15 columns (id, name, generation, legendary/mythical flags, both types, the six base stats, and base-stat total).
- Codebook — a plain-English description of every column.
Sources & license
Full attribution and the methodology write-up are in SOURCES.md.
Data is from PokéAPI — a community-run, keyless public REST API of Pokémon game data. Pokémon names, stats, and types are © Nintendo / Game Freak / The Pokémon Company, used here nominatively (fun-tier, non-commercial, attributed).
AI-Assisted Development This project was built with the assistance of Kiro, an AI-powered development environment. All data sourcing decisions, methodology choices, and published findings are the responsibility of the author. AI was used for code generation, data pipeline construction, and research assistance — not for analysis conclusions or editorial judgment.