@unwelcomedata · data from public sources Follow for new charts: X · Bluesky
The Marvel Cinematic Universe, by the box office
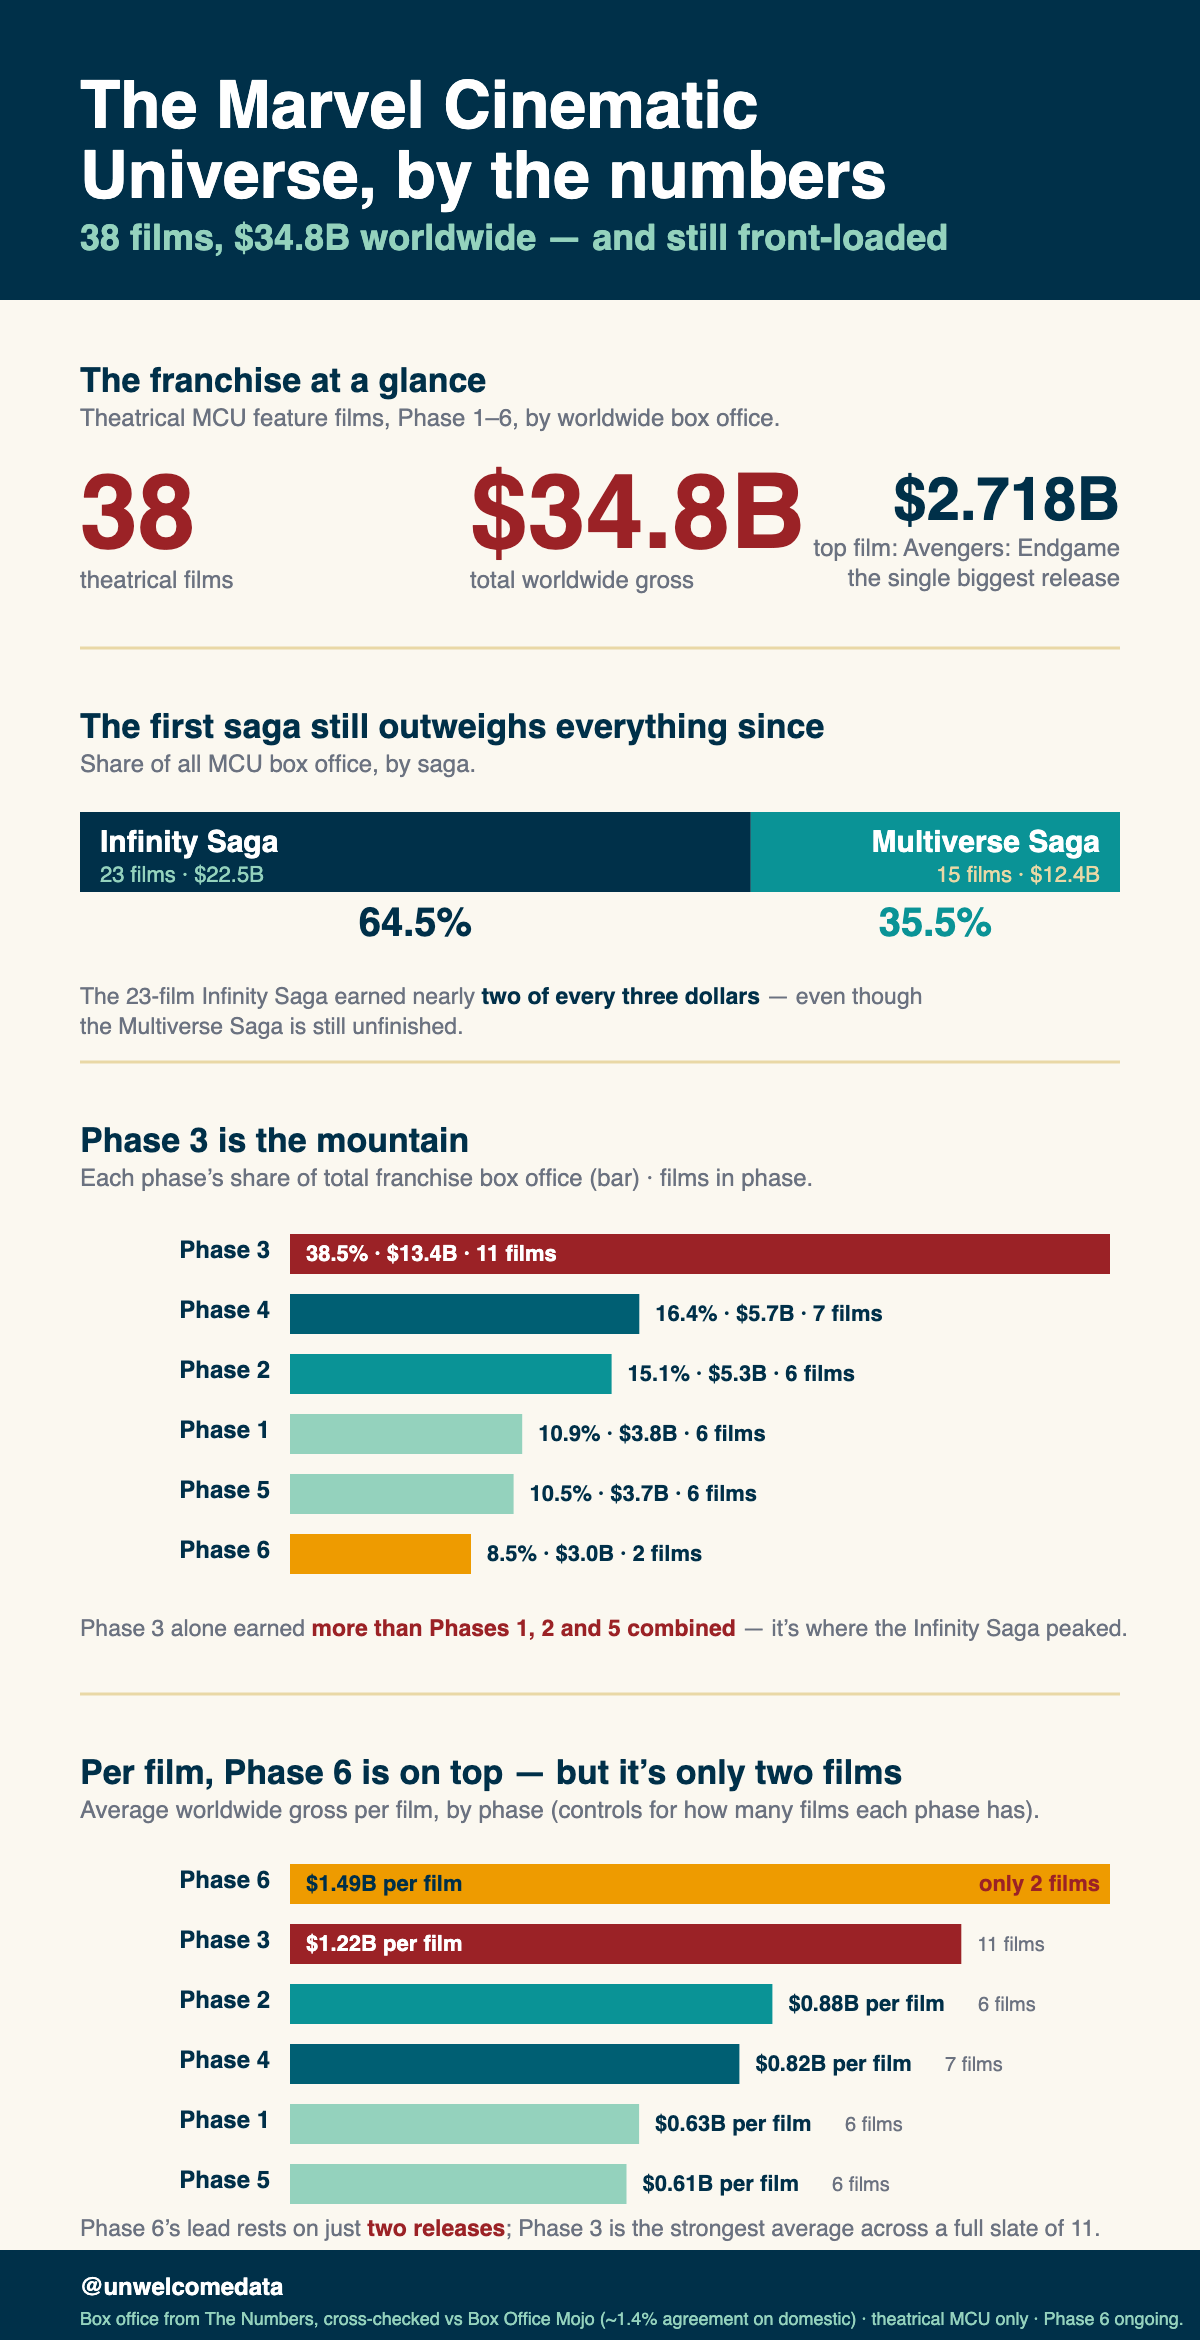
Twenty-something films, six Phases, two Sagas, $34.8 billion worldwide. This is the MCU as a part-of-whole picture — every theatrical film sized by what it earned, grouped by where it sits in the story — plus a couple of cuts that ask which era actually carried the franchise.
The findings:
- One Phase carries the franchise. Phase 3 (2016–2019: Civil War through Far From Home, with Infinity War and Endgame) is ~38% of all MCU box office — 11 films, $13.4B, more than Phases 1 and 2 combined.
- The finished Saga still outweighs the ongoing one. The Infinity Saga (Phases 1–3) is 64.5% of the total; the entire Multiverse Saga so far (Phases 4–6) is 35.5% — even though it has been running for years.
- Volume isn’t the whole story. Correcting for how many films each Phase has, the average film earned most in Phase 6 ($1.49B, but only two films so far) and Phase 3 ($1.22B) — while Phase 5 films averaged the least ($0.61B).
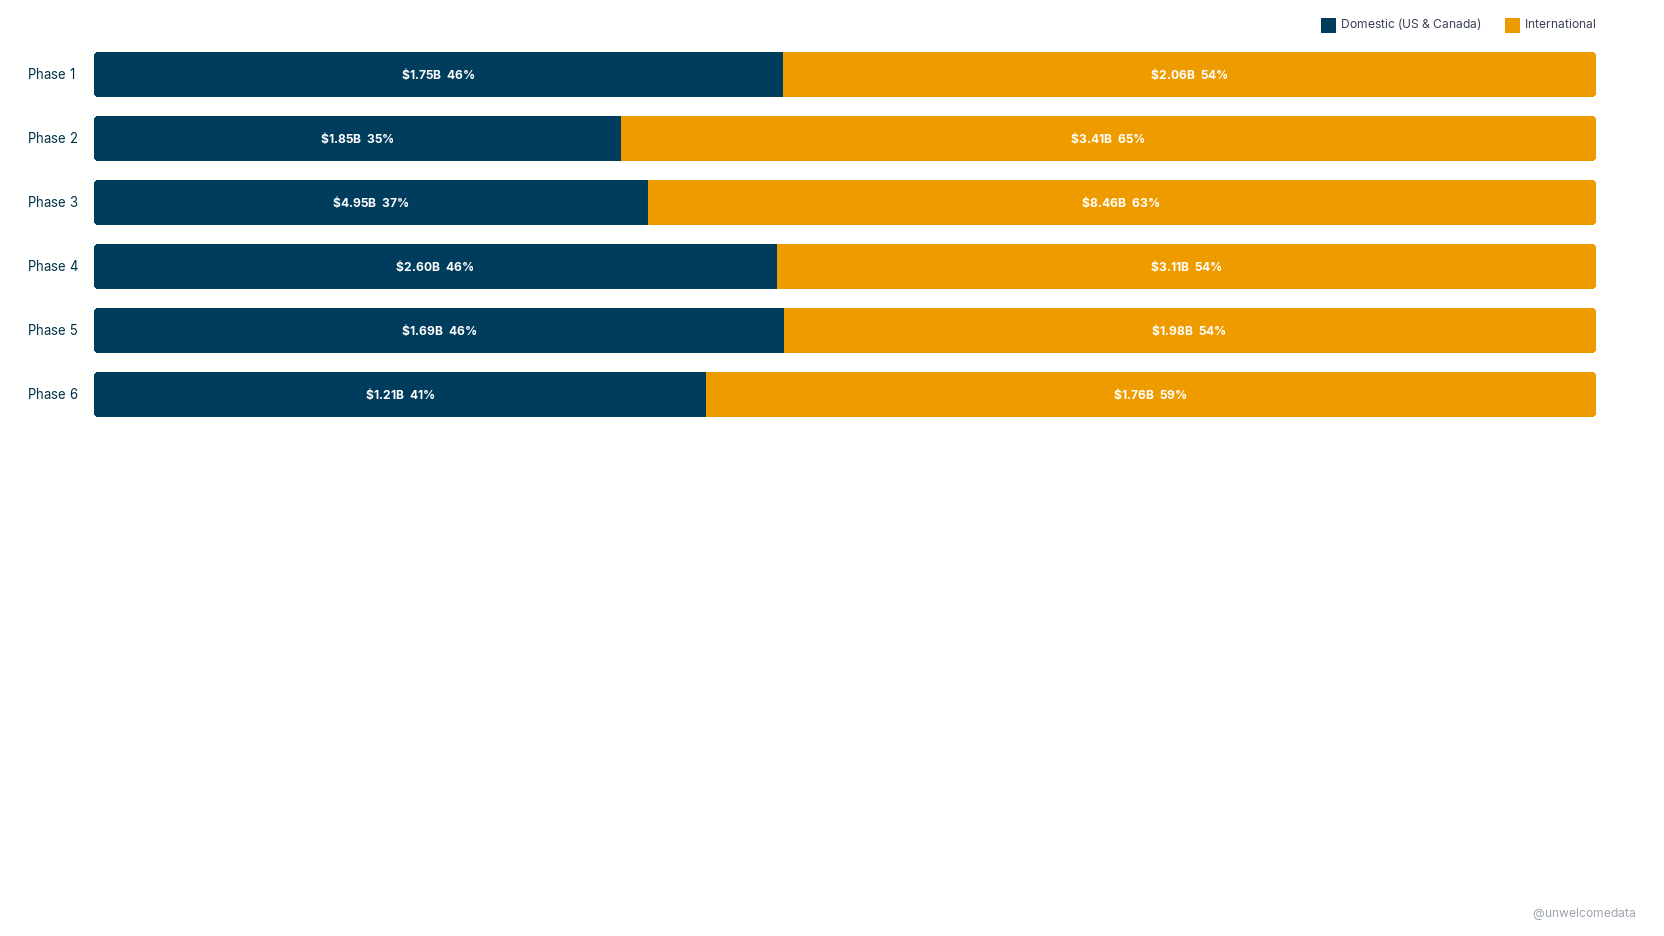
- The MCU earns most of its money abroad, and always has — international box office is the majority share in every Phase.
Click any chart to open it at full resolution.
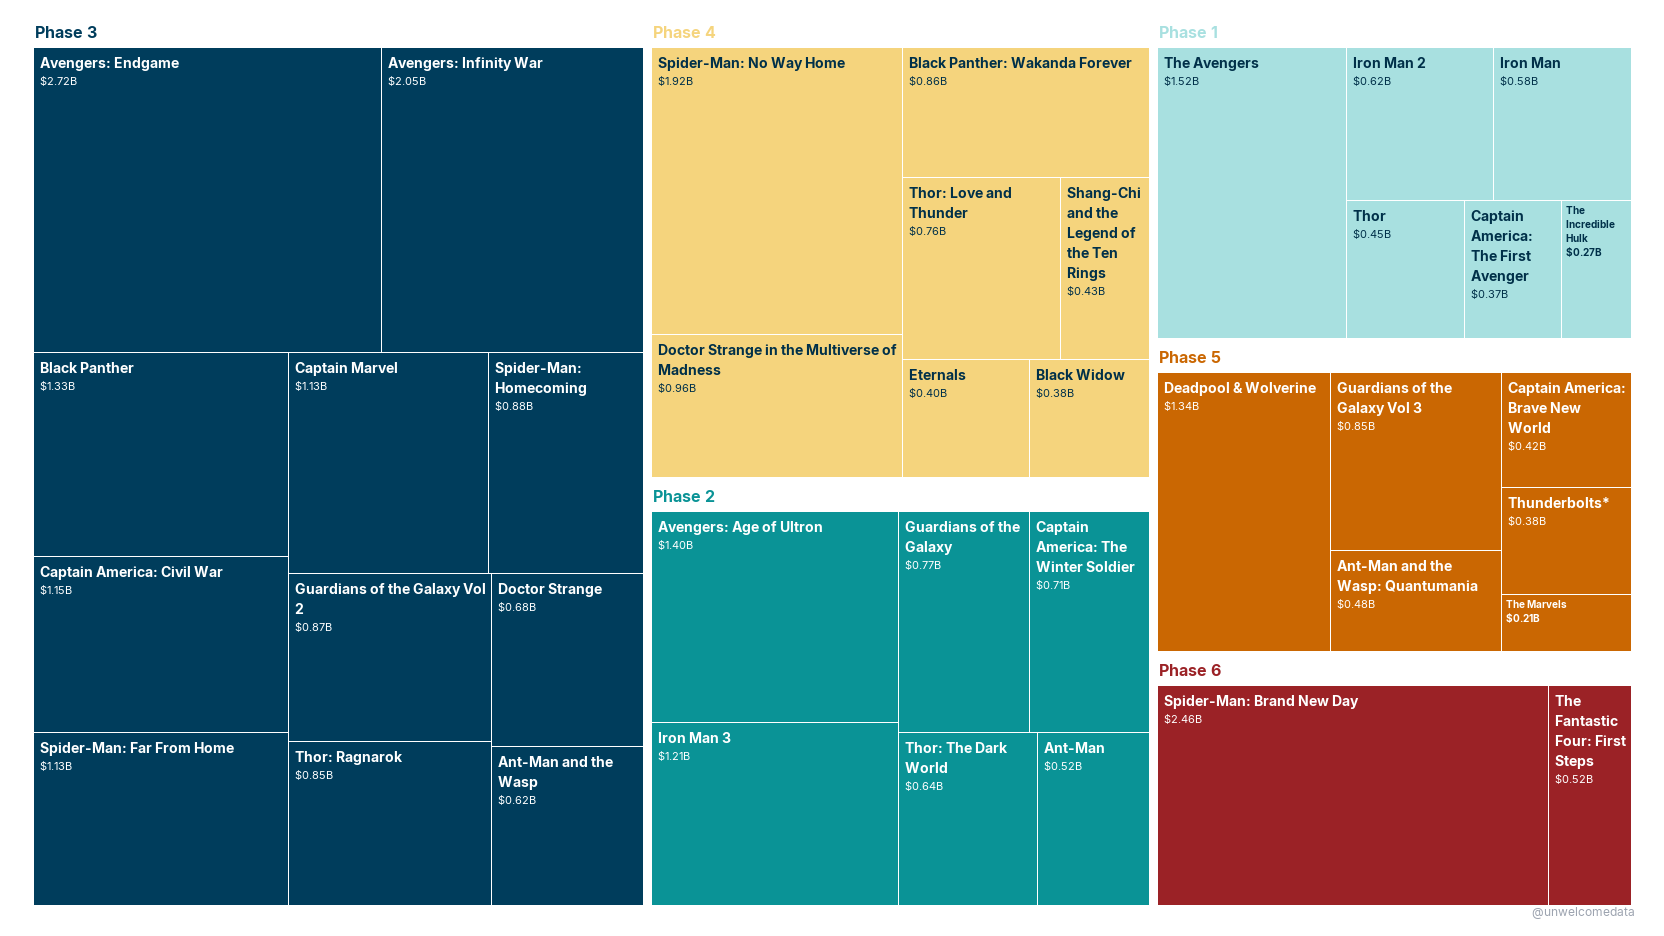
1. The whole franchise, film by film
Every released theatrical MCU film as a tile sized by its lifetime worldwide gross, grouped and colored by Phase (cool blues = the Infinity Saga, Phases 1–3; warm golds/red = the Multiverse Saga, Phases 4–6). The giant tiles — Endgame ($2.72B), Brand New Day ($2.46B), Infinity War ($2.05B), No Way Home ($1.92B) — are the franchise’s tentpoles; Phase 3’s block dwarfs the rest.
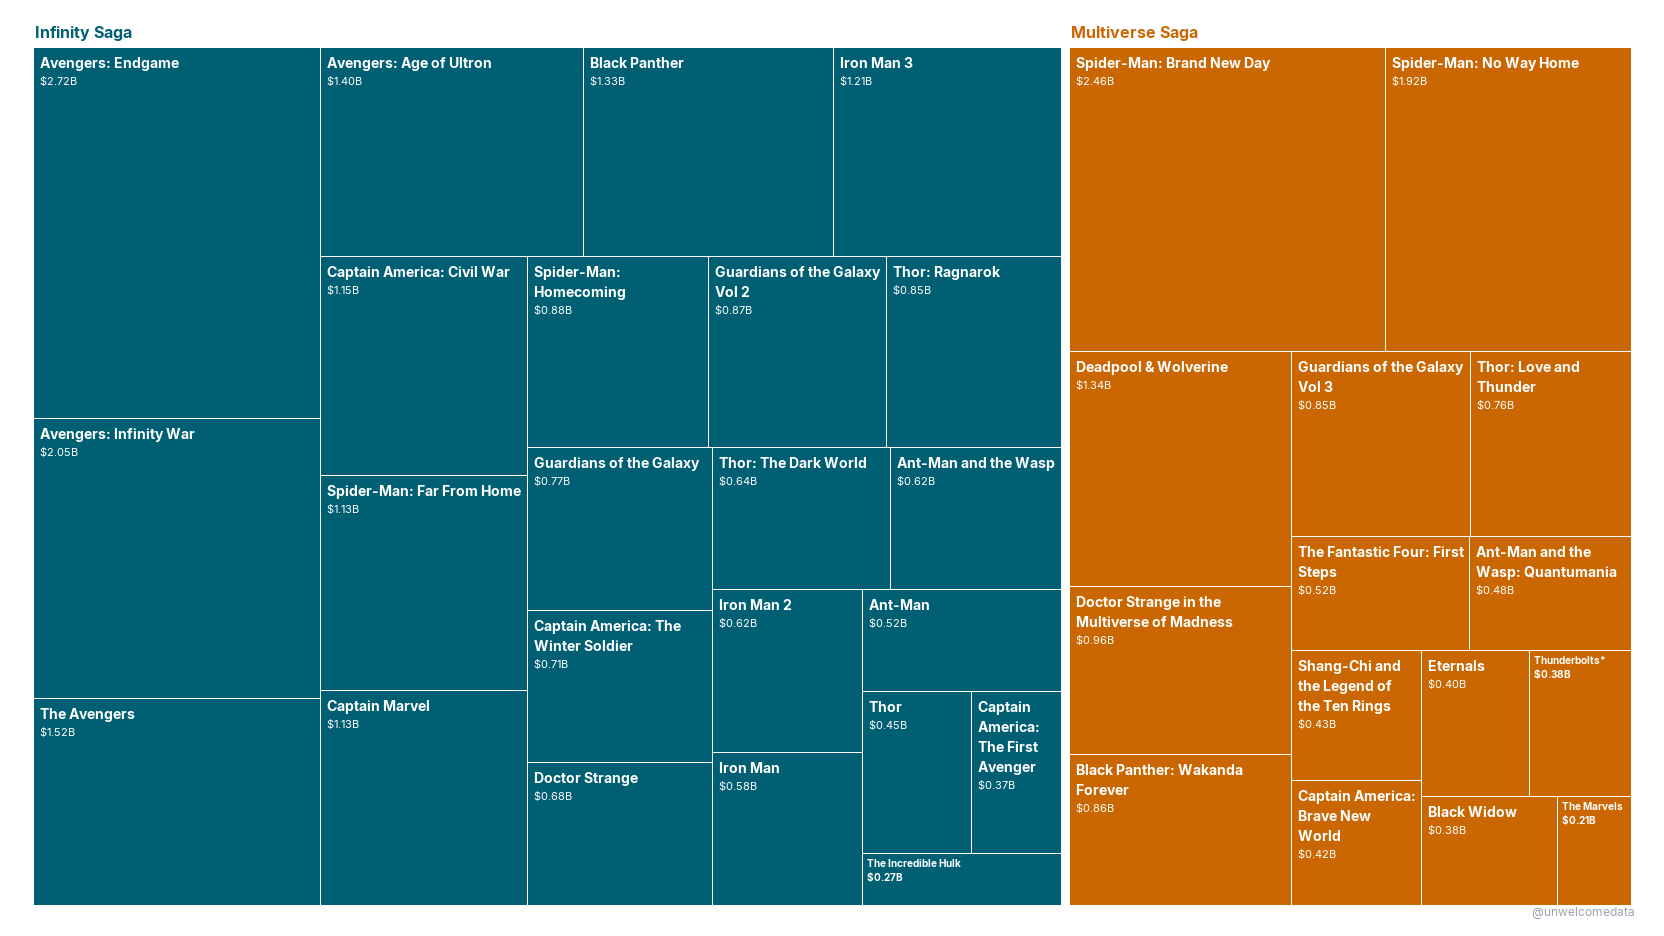
2. Infinity Saga vs. Multiverse Saga
The same films, colored by Saga. The finished three-Phase Infinity Saga (teal) still takes up almost two-thirds of the picture; everything since Endgame (the Multiverse Saga, orange) is the smaller block.
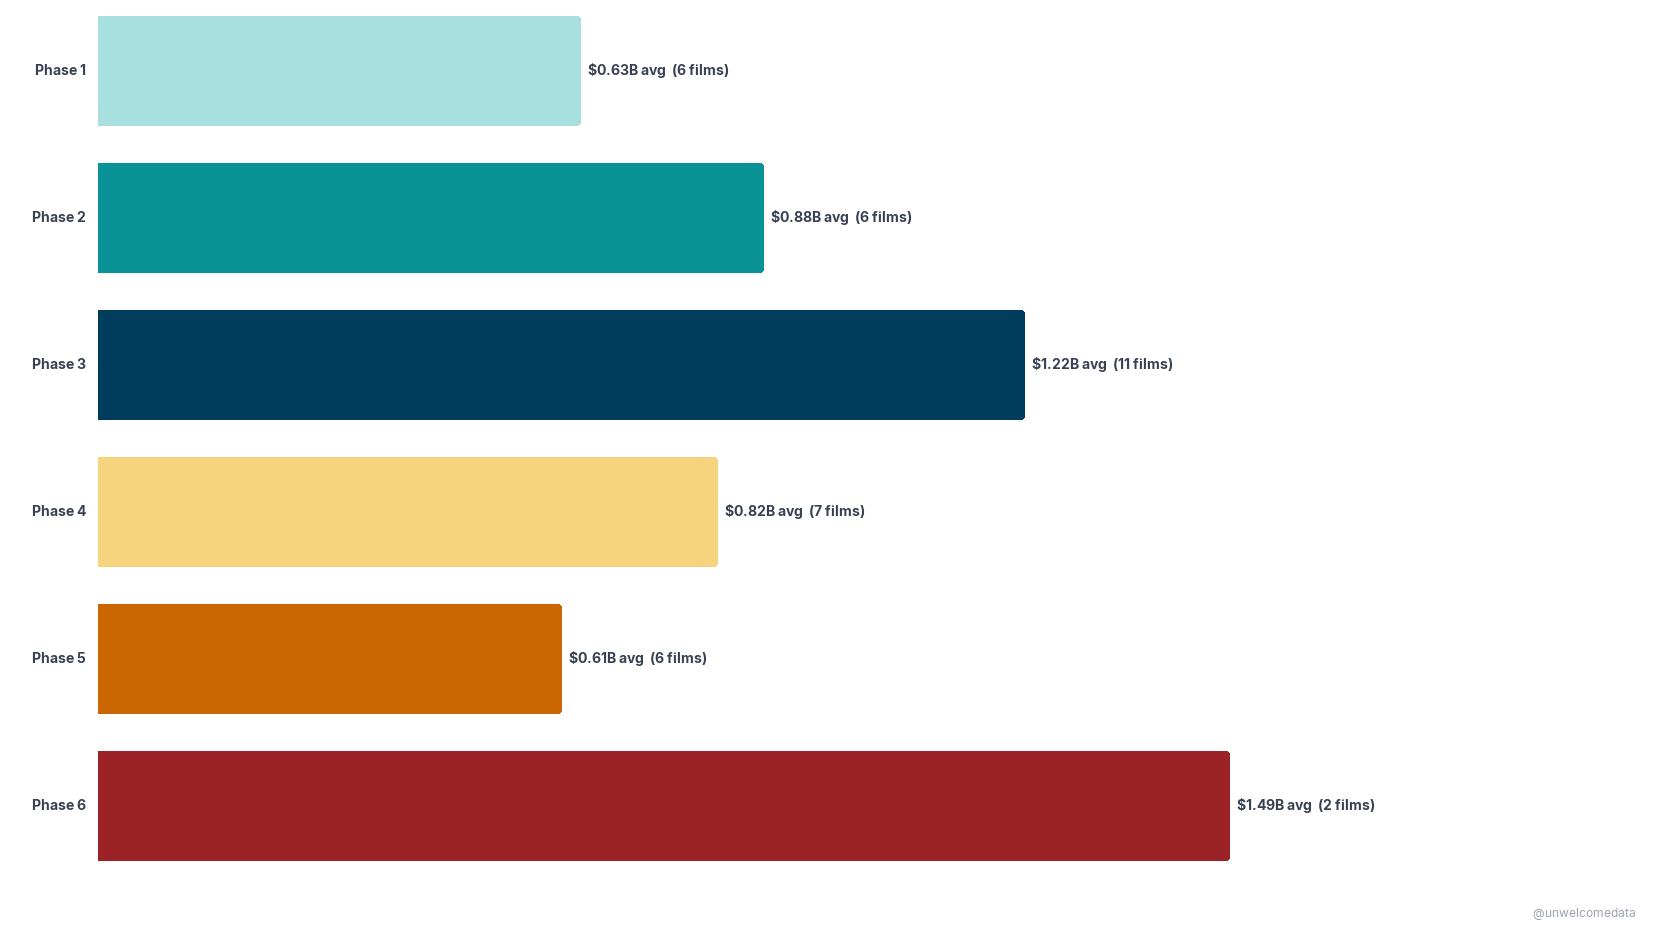
3. Average box office per film, by Phase
Total gross rewards Phases that simply had more films, so this is the fairer comparison: the average lifetime worldwide gross per film in each Phase (film counts shown in each bar). Phase 3 both had the most films and averaged high. Phase 6’s chart-topping average rests on just two films, and its figure is as of September 2026 — Spider-Man: Brand New Day was still in theaters, so it will keep rising.
4. Where the money comes from — home vs. abroad
Each Phase’s worldwide gross split into domestic (U.S. & Canada) vs. international, normalized to 100% so the mix is comparable (dollar amounts shown inside each segment). International is the majority in every Phase; the foreign share peaks in the mid-Phases (Iron Man 3 / Ultron era) then eases back.
How it’s measured
- Scope: released theatrical MCU feature films only — Marvel Studios’ Phase 1–6 canon, Iron Man (2008) through Spider-Man: Brand New Day (2026), including the Sony-distributed Tom Holland Spider-Man films (they’re MCU-canon and both trackers file them under the franchise). No Disney+ series, no TV specials, no unreleased/future films.
- Grosses are nominal (year-of-release dollars), not inflation-adjusted — this project is about each film’s share of the franchise, not cross-era ranking, so no adjustment is applied.
- Snapshot as of 2026-09-19. Films still in theaters (Brand New Day) have lifetime totals that will keep climbing; treat those as lower bounds.
The data
The published dataset is in export/ with a codebook describing every
column:
mcu_box_office_v1.csv— one row per film: worldwide / domestic / international gross, Phase, Saga, share of franchise / Saga / Phase, opening weekend, budget.
Sources & license
Box-office figures are cited from The Numbers (per-film domestic + worldwide gross) and cross-checked against Box Office Mojo — the two independent trackers agree on domestic gross to within ~1.4%. Phase/Saga groupings are Marvel Studios’ official designations. Full attribution and caveats in SOURCES.md. These are publicly reported box-office facts, transformed into new metrics and attributed here — not a redistribution of any provider’s dataset.
AI-Assisted Development This project was built with the assistance of Kiro, an AI-powered development environment. All data-sourcing decisions, methodology choices, and published findings are the responsibility of the author. AI was used for code generation, data-pipeline construction, and research assistance — not for analysis conclusions or editorial judgment.