@unwelcomedata · data from public sources
Follow for new charts: X · Bluesky
Highest-Grossing Films: it depends entirely on how you count
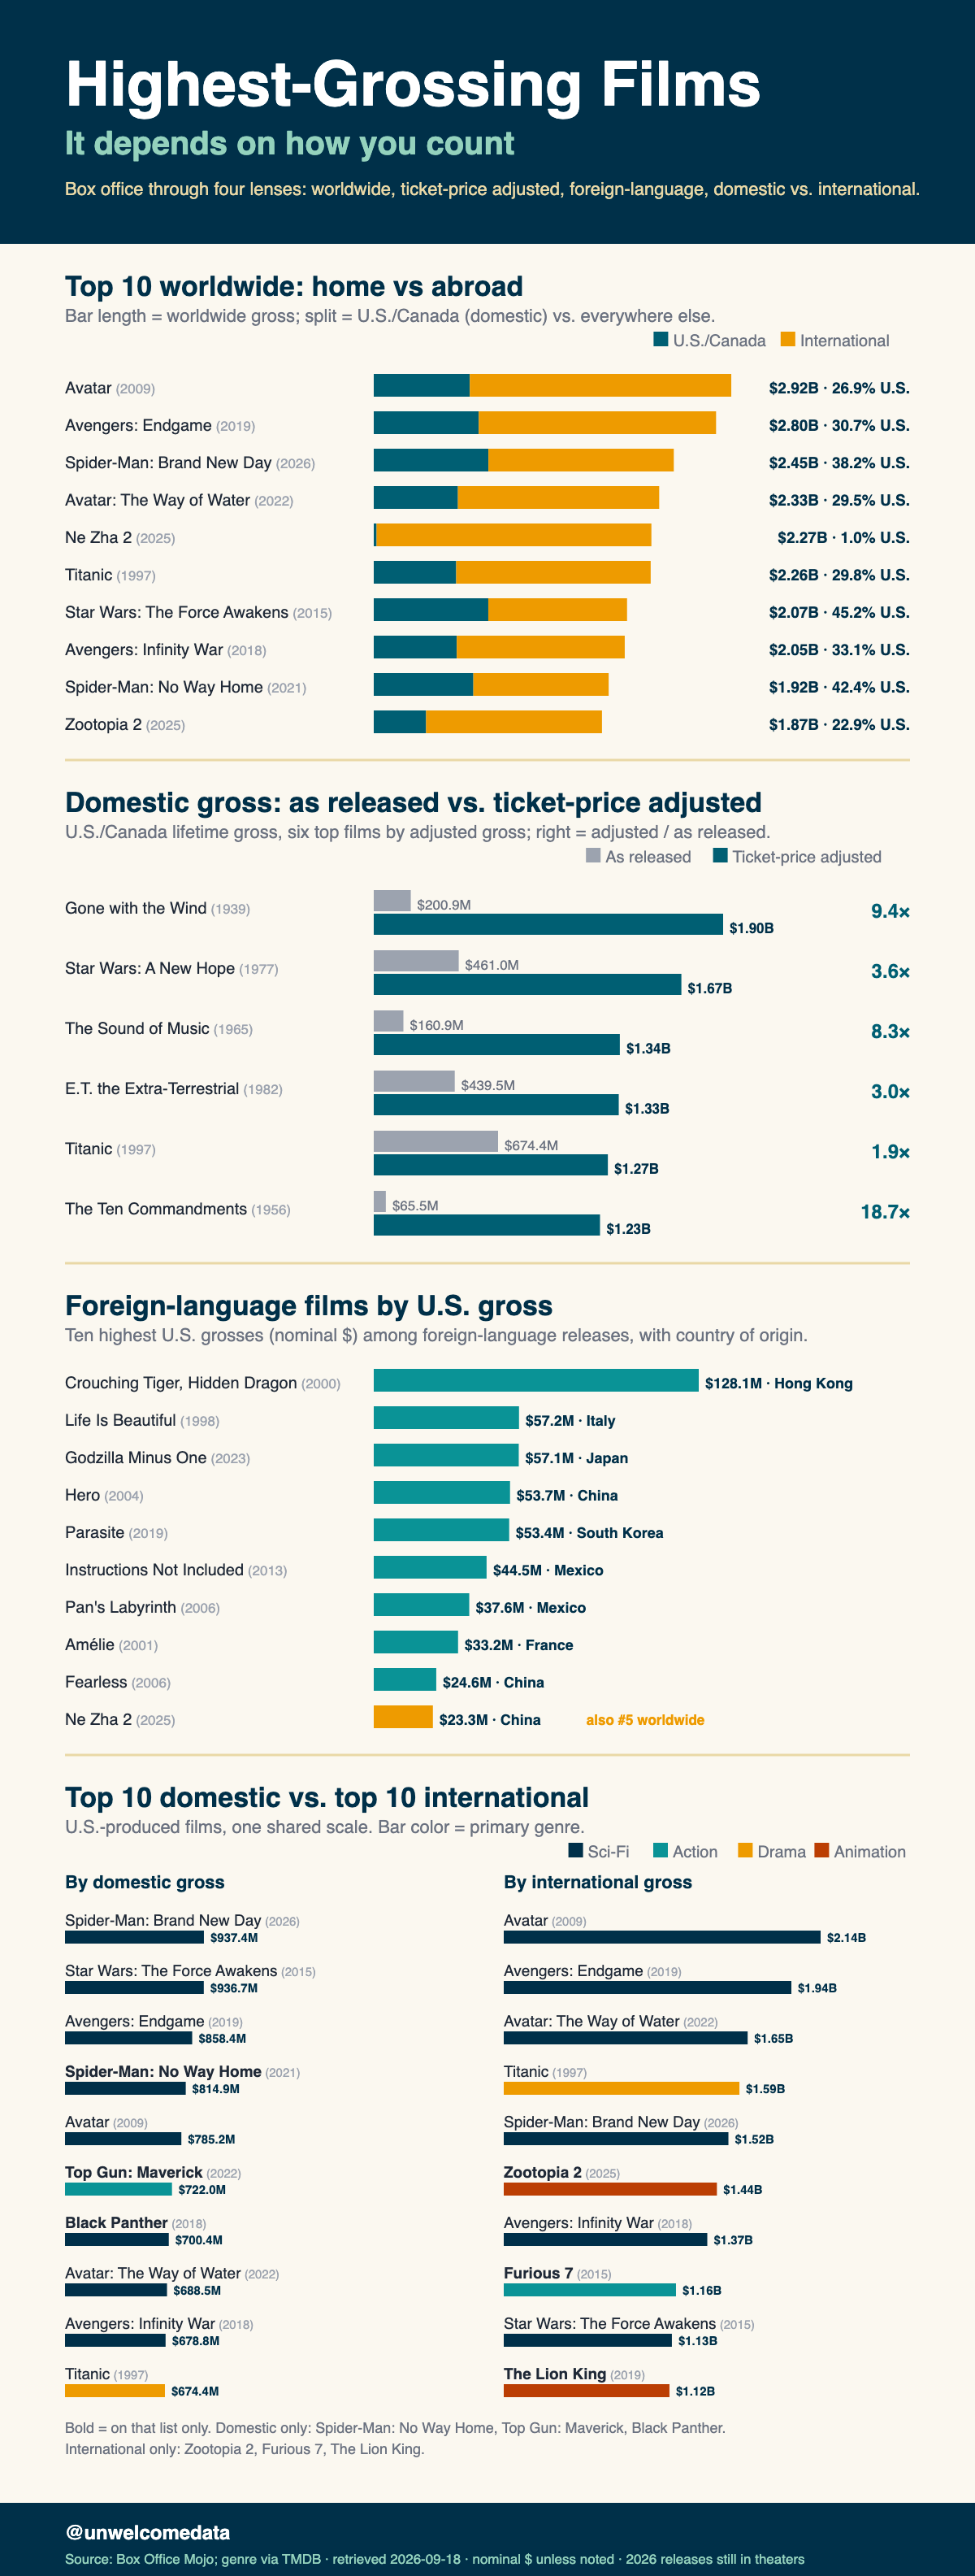
Ask which films are the biggest ever and you get different answers depending on where and when you measure. This project lays a few honest lenses side by side — home vs. abroad, nominal vs. inflation-adjusted, and English vs. foreign-language — because the disagreements between them are the interesting part.
The findings:
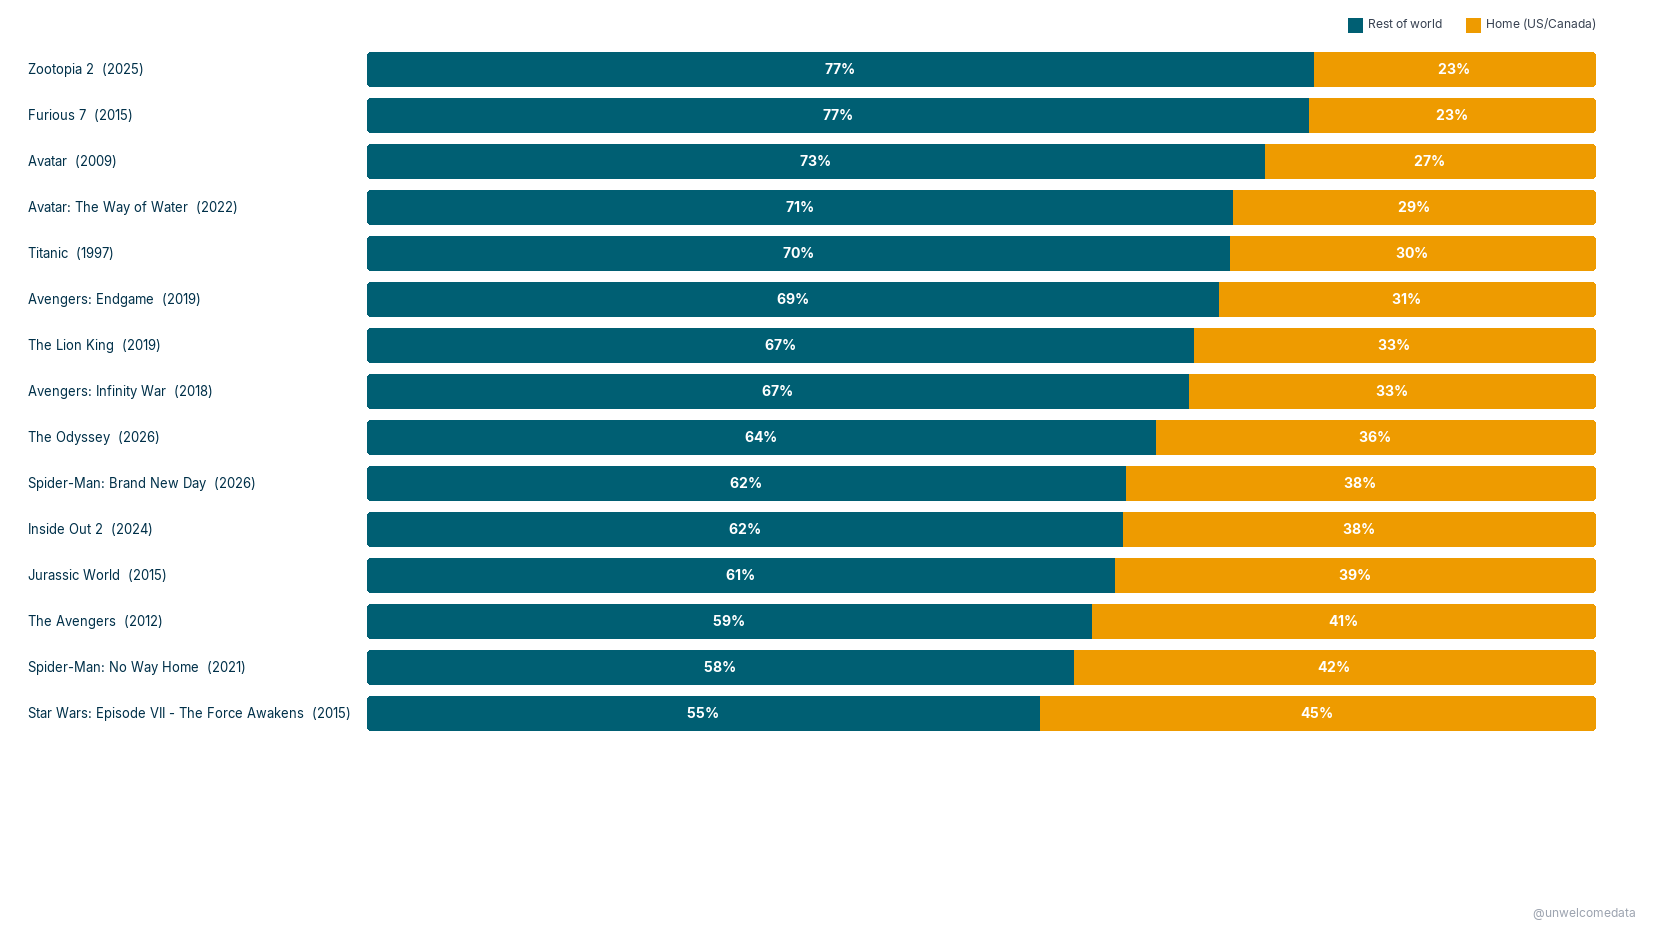
- Hollywood’s biggest films make most of their money abroad. For nearly every top U.S.-produced film, the rest-of-world box office dwarfs the home (U.S. & Canada) take. Avatar made $785M at home and $2.1B abroad.
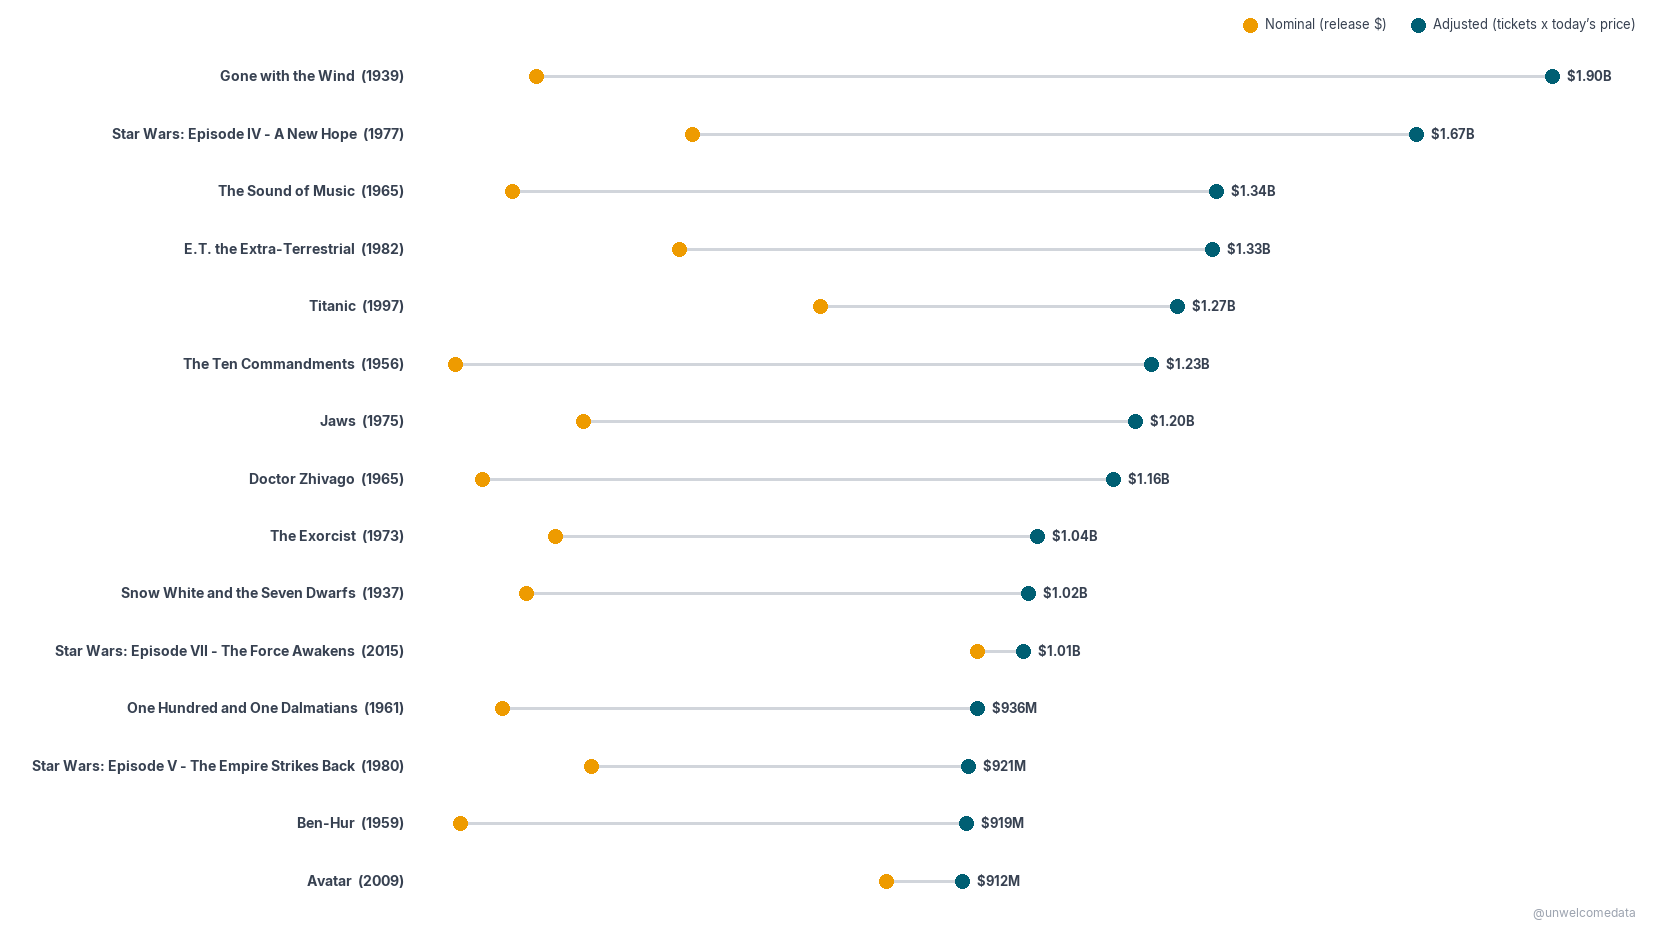
- Adjust for ticket-price inflation and the biggest domestic film is from 1939. On an admissions basis (estimated tickets sold × today’s ticket price), Gone with the Wind still tops the domestic chart (~$1.9B), ahead of Star Wars (1977) and The Sound of Music (1965). Modern hits only lead the nominal board.
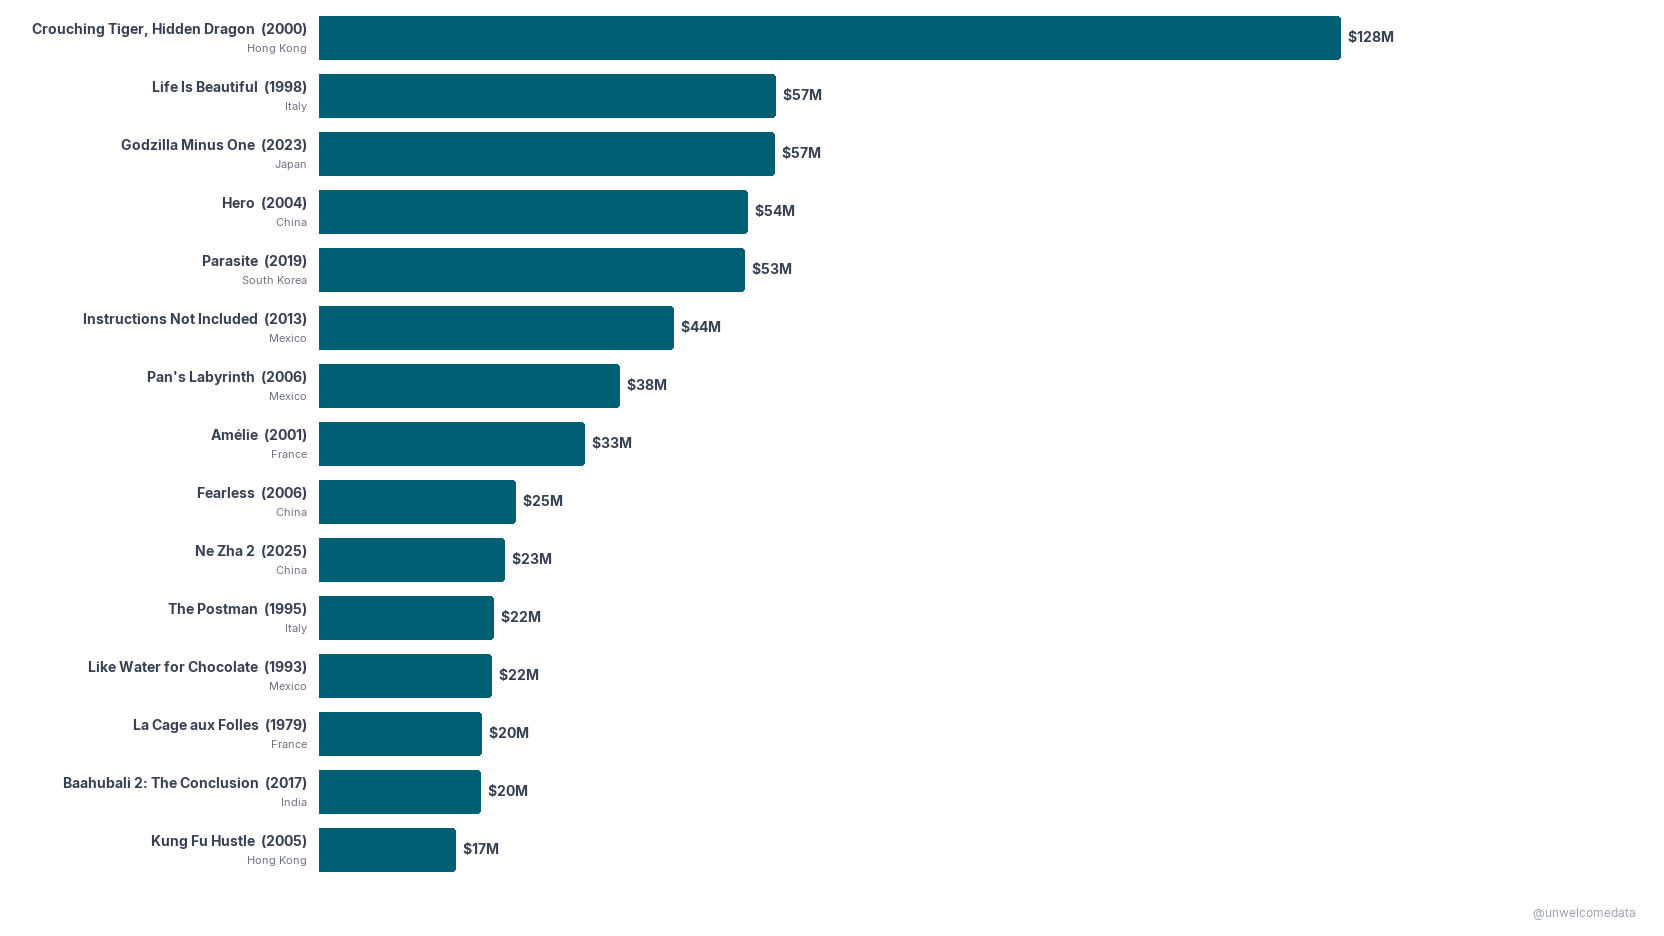
- The foreign-language film that broke furthest into the U.S. isn’t recent. Crouching Tiger, Hidden Dragon (2000) leads U.S. box office for a non-English film (~$128M), ahead of Life Is Beautiful, Godzilla Minus One, and Parasite.
A note on “domestic.” Box Office Mojo’s “domestic” means the U.S. & Canada market — which only equals a film’s home market for U.S.-made films. So the home-vs-abroad chart is restricted to U.S.-produced films. A Chinese blockbuster like Ne Zha 2 (~$2.3B, almost entirely at home) would otherwise look like it “earned it all abroad” when it earned it in its own country.
Click any chart to open it at full resolution.
1. Hollywood’s biggest films make most of their money abroad
Top 15 U.S.-produced films by worldwide gross, ordered by the share earned abroad. Teal = rest of world, gold = home (U.S. & Canada) — the teal segment grows for the more internationally-dependent films.
2. The biggest domestic films, adjusted for inflation
A different question: within the U.S. & Canada, once ticket-price inflation is accounted for, who sold the most tickets? This uses Box Office Mojo’s adjustment — estimated tickets sold × today’s average ticket price, effectively an admissions ranking. The gold dot is what each film actually made at the time (nominal); the connector shows how far the adjustment moves it.
3. The foreign-language films that broke into the U.S.
Which non-English-language films earned the most in the U.S. & Canada, in nominal (year-of-release) dollars — there’s no reliable admissions adjustment for this list, so older titles are modestly understated. Country of origin is under each title — the list is more diverse than you’d guess (Hong Kong, Italy, Japan, China, South Korea, Mexico).
4. Top 10 at home vs. top 10 abroad — two different lists
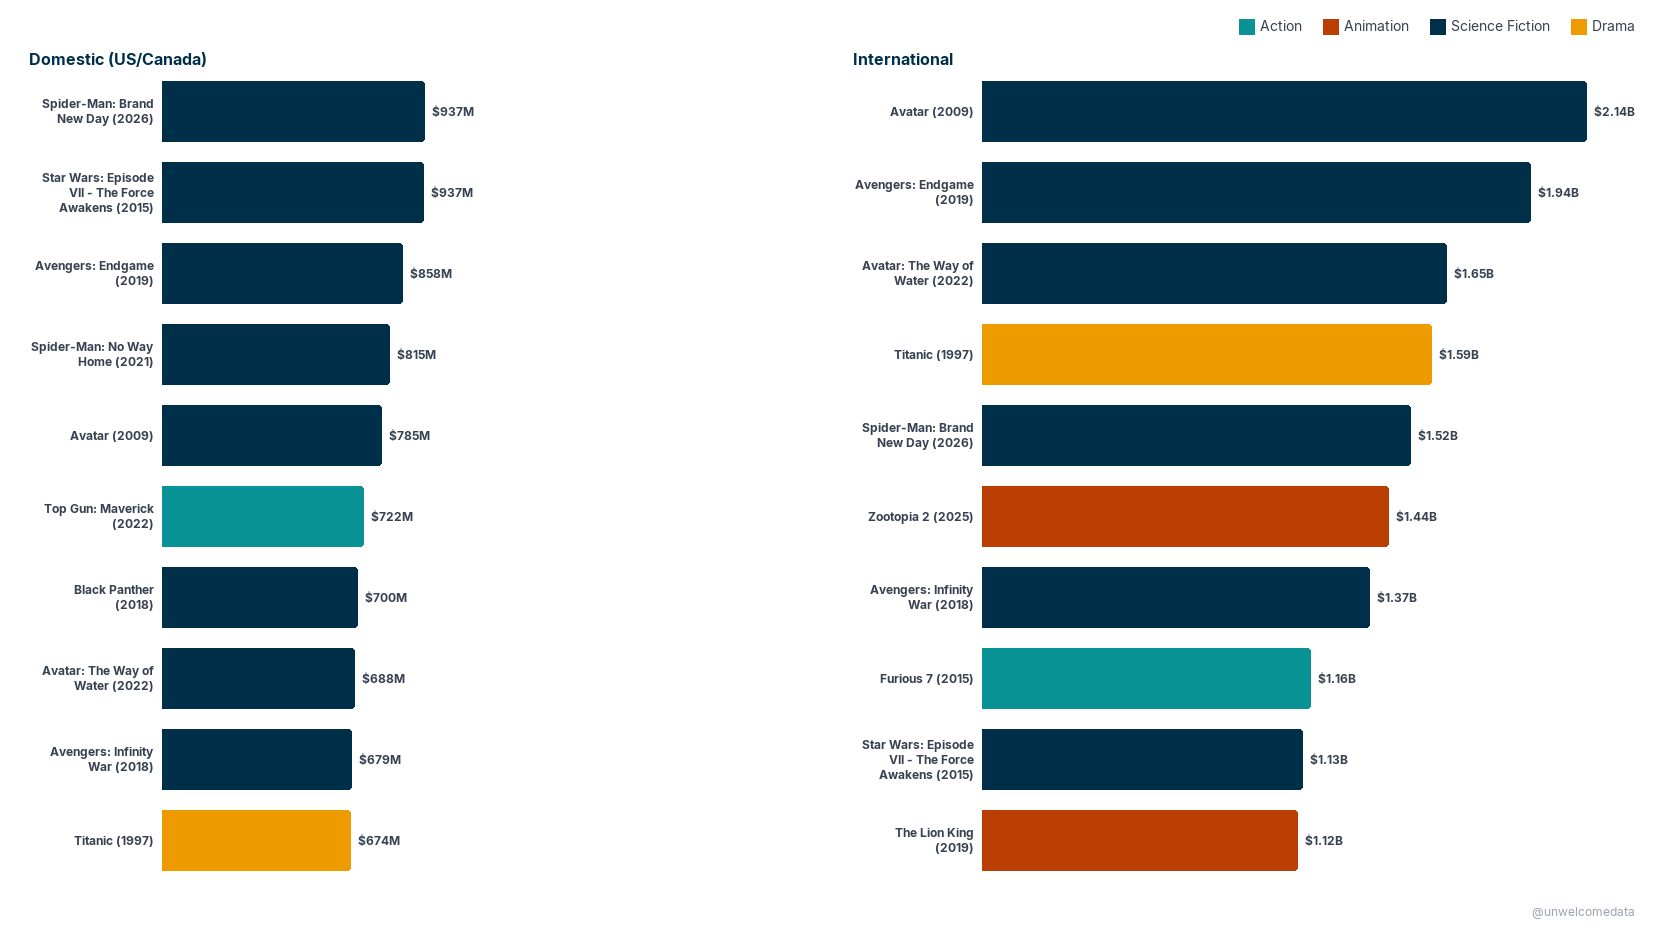
Two independent top-10 lists of U.S.-produced films: the left panel ranks the 10 highest by domestic (U.S. & Canada) gross, the right ranks the 10 highest by international gross. Because they’re separate rankings, the story is who makes one list but not the other. Three films are domestic-only top-10 — Top Gun: Maverick, Black Panther, Spider-Man: No Way Home (home favorites) — while three are international-only — Furious 7, The Lion King, Zootopia 2 (global travelers). At the top of the domestic list, Spider-Man: Brand New Day (2026) is now the highest-grossing domestic film of all time (~$937M), having just edged past Star Wars: The Force Awakens — though it’s still in theaters, so that figure is a lower bound. Both panels share one dollar scale (values in nominal year-of-release dollars), so the size gap is honest: even the biggest domestic performer sits below almost the entire international board, which runs past $2B. Each bar is colored by the film’s primary genre (see legend).
How it was measured
- Home / abroad grosses are nominal (year-of-release dollars) from Box Office Mojo’s worldwide lifetime chart. Domestic = U.S. & Canada; the rest is “abroad.” Chart 1 shows shares of each film’s own total, so inflation doesn’t distort it.
- The domestic adjusted chart uses ticket-price inflation (Box Office Mojo’s own adjustment): estimated tickets sold × a reference-year average ticket price. This is effectively an admissions ranking — it counts people through the door, which is the sound way to compare films across eras. (We tried a CPI-U “general inflation” adjustment and dropped it: ticket prices have risen much faster than general CPI, so CPI-adjusting old grosses overstates old films unevenly by era. Admissions is the honest basis.)
- Foreign-language (chart 3) means non-English-language films, from Box Office Mojo’s Foreign Language chart, ranked by U.S. & Canada lifetime gross in nominal dollars (no reliable admissions adjustment exists for this list, so older titles are modestly understated). Country of origin comes from TMDB.
- Re-releases inflate the lifetime totals of some classics (Gone with the Wind, Star Wars, E.T. were re-released theatrically) — their totals reflect total historical audience, not one release.
Snapshot as of September 2026. Box-office figures are lifetime-to-date; films still in theaters when the data was pulled (some 2026 titles) have totals that will keep rising, so treat those as lower bounds.
Full per-source detail, definitions, and caveats are in SOURCES.md.
The data
Published datasets are in export/, each with a *_codebook.md
describing every column:
highest_grossing_films_v1.csv— top domestic films, ticket-price adjusted gross alongside nominal gross, estimated tickets, and release year.films_worldwide_v1.csv— worldwide top films with the home / abroad split.films_foreign_us_v1.csv— top foreign-language films by U.S. & Canada gross, with country of origin.
Sources & license
Box Office Mojo (domestic lifetime + ticket-price adjusted, worldwide, and foreign-language grosses) and TMDB (country of origin). Full attribution and caveats in SOURCES.md. “This product uses the TMDB API but is not endorsed or certified by TMDB.” No crowd-edited sources are used.
AI-Assisted Development This project was built with the assistance of Kiro, an AI-powered development environment. All data-sourcing decisions, methodology choices, and published findings are the responsibility of the author. AI was used for code generation, data-pipeline construction, and research assistance — not for analysis conclusions or editorial judgment.