@unwelcomedata · data from public sources
We say “Big Pharma” and “Big Oil.” Why not “Big Education”?
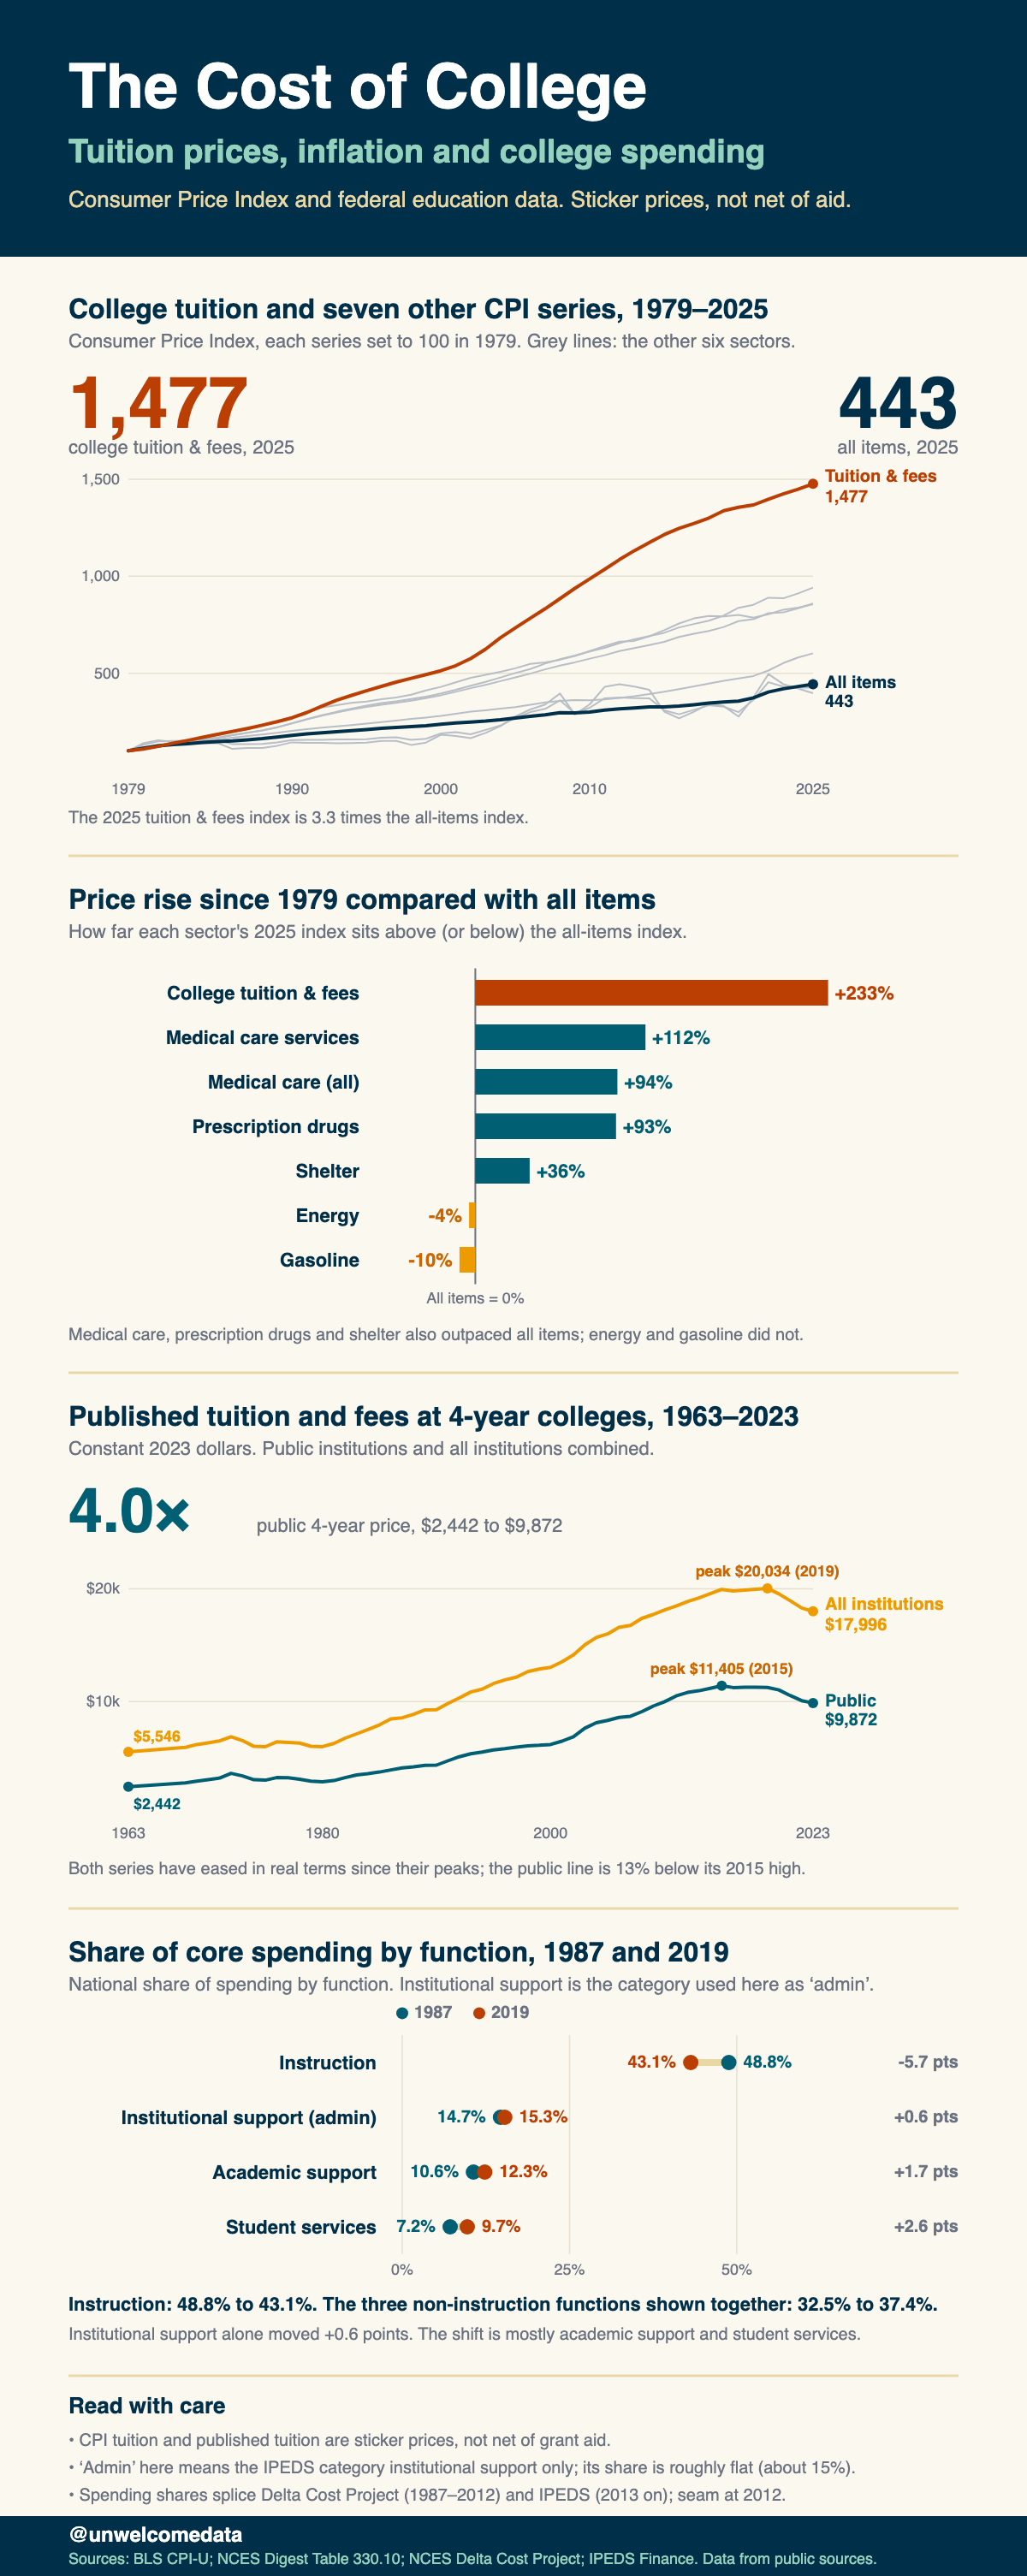
Since 1979, the price of college has out-run general inflation and every other “big” sector people complain about — healthcare, prescription drugs, housing, even oil and energy. College tuition & fees rose roughly fourteen times over since 1979, versus about four and a half times for prices overall. On the sticker-price measure that drives the “unaffordable college” conversation, higher education is the steepest cost line in the economy — yet it never gets the “big industry” branding the others do.
This project builds that comparison from U.S. federal, public-domain data: BLS Consumer Price Index sector sub-indices, the NCES Digest of Education Statistics, and the NCES Delta Cost Project + IPEDS finance records. It also asks the honest follow-up — where does the money go? — and reports what the data actually supports, not the easy headline.
The findings that held up:
- Tuition is the steepest sector. Re-indexed so 1979 = 100, college tuition & fees reaches ≈ 1,477 by 2025 — above medical-care services (≈ 942) and roughly 3× general inflation (All Items ≈ 443).
- It out-ran general inflation by more than any other sector — ≈ +233%. Measured against All Items (the zero baseline), tuition beat general inflation by about 233 percentage points; medical-care services by ≈ +112%. Gasoline (≈ −10%) and energy (≈ −4%) actually lagged inflation over the full window.
- In real dollars, public 4-year tuition roughly quadrupled — from ≈ $2,442 (1963-64) to ≈ $9,872 (latest), in constant dollars, i.e. after inflation.
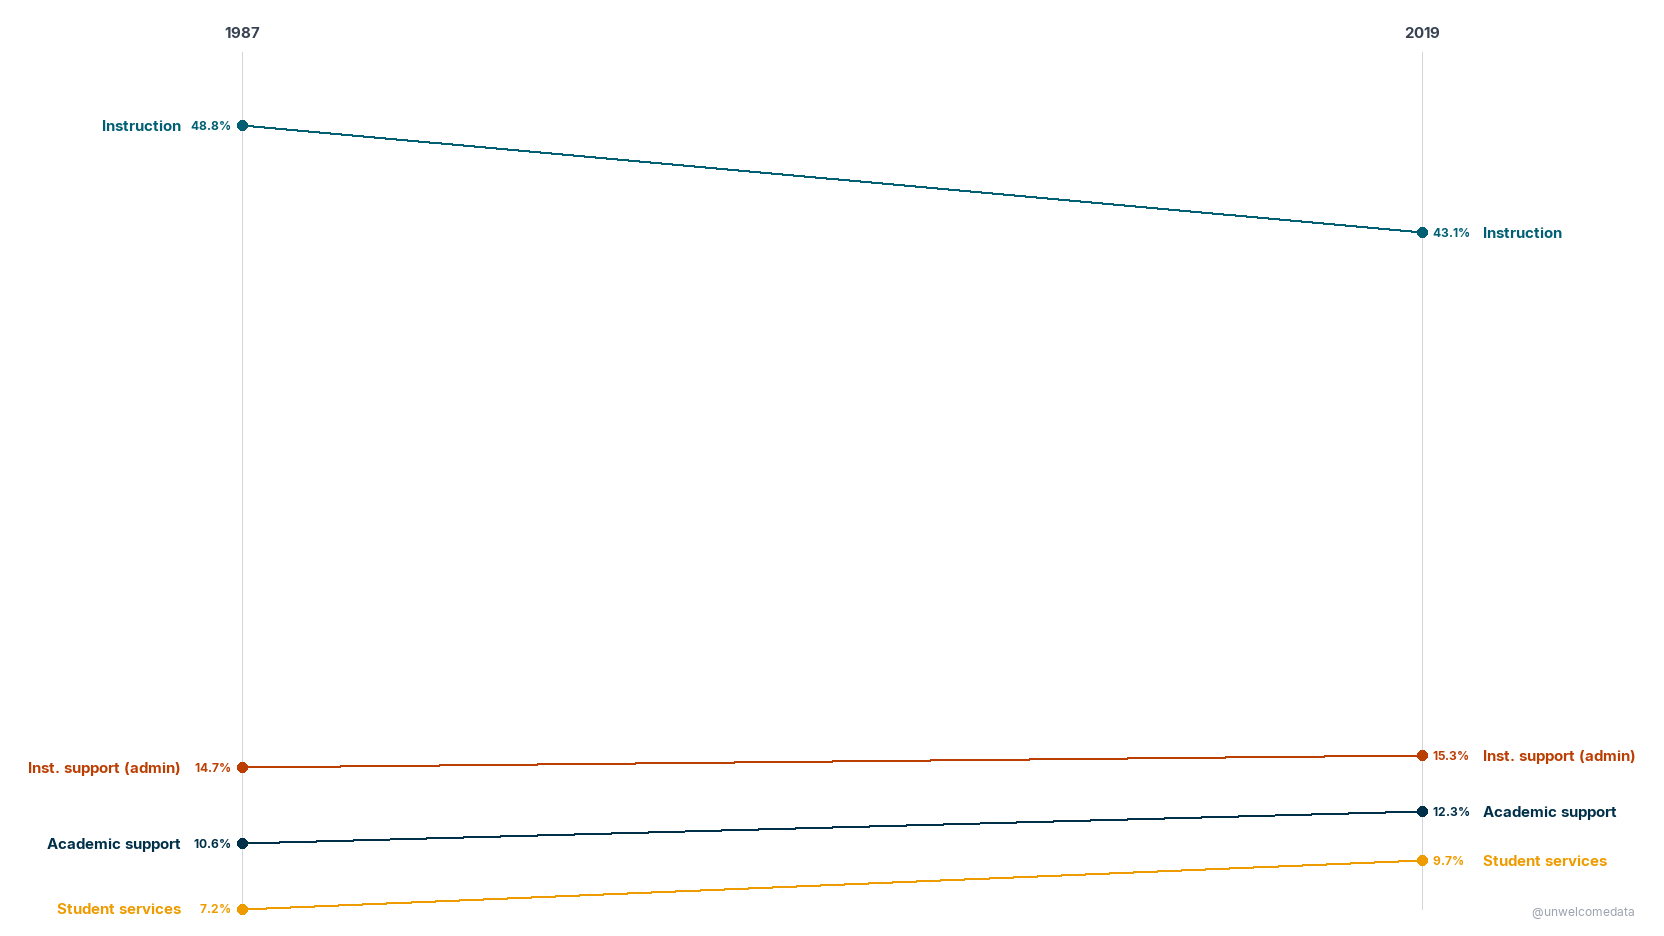
- The money shifted away from the classroom — but it’s not “administrators alone.” Instruction’s share of core spending fell (≈ 48.8% → 43.1%) while non-instructional spending rose (≈ 32.5% → 37.4%). The honest part: institutional support (the IPEDS “admin” line) is roughly flat (≈ 15%) — the growth is in student services and academic support. “Non-instructional outgrew instruction” is defensible; “administrators alone exploded” is not what this data says.
The charts
Click any chart to open it full size. CPI figures are BLS CPI-U, U.S. city average, not seasonally adjusted, annual averages.
We say “Big Pharma” and “Big Oil.” Why not “Big Education”? Every CPI sector re-indexed so 1979 = 100 — a line’s height is the cumulative price rise since 1979 (400 means prices quadrupled). The window starts in 1979 because that’s where the BLS college-tuition sub-index begins (December 1978); every sector is truncated to that common base. College tuition & fees is the steepest line by a wide margin, far above the medical-care and energy lines.
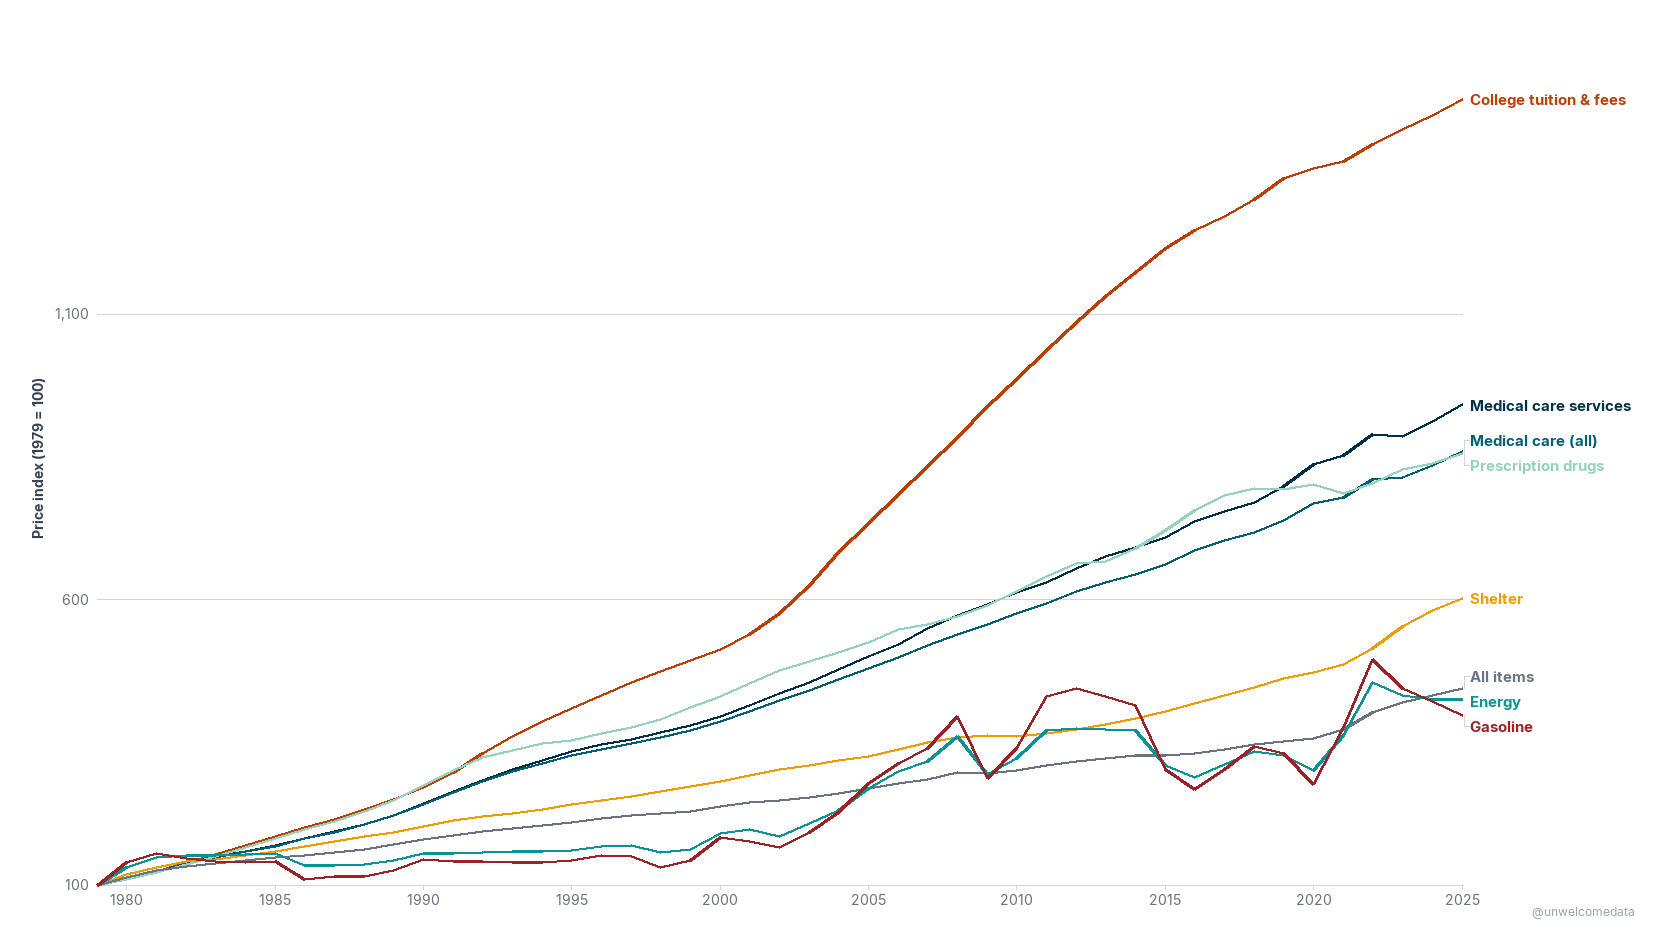
How much each sector out-ran general inflation, 1979 → latest. Each sector’s cumulative price change relative to All Items — so All Items = 0 is the zero baseline, bars to the right beat general inflation, bars to the left lagged it. College tuition & fees is the largest positive bar at ≈ +233%; gasoline and energy sit below zero (they lagged general inflation over this long window).
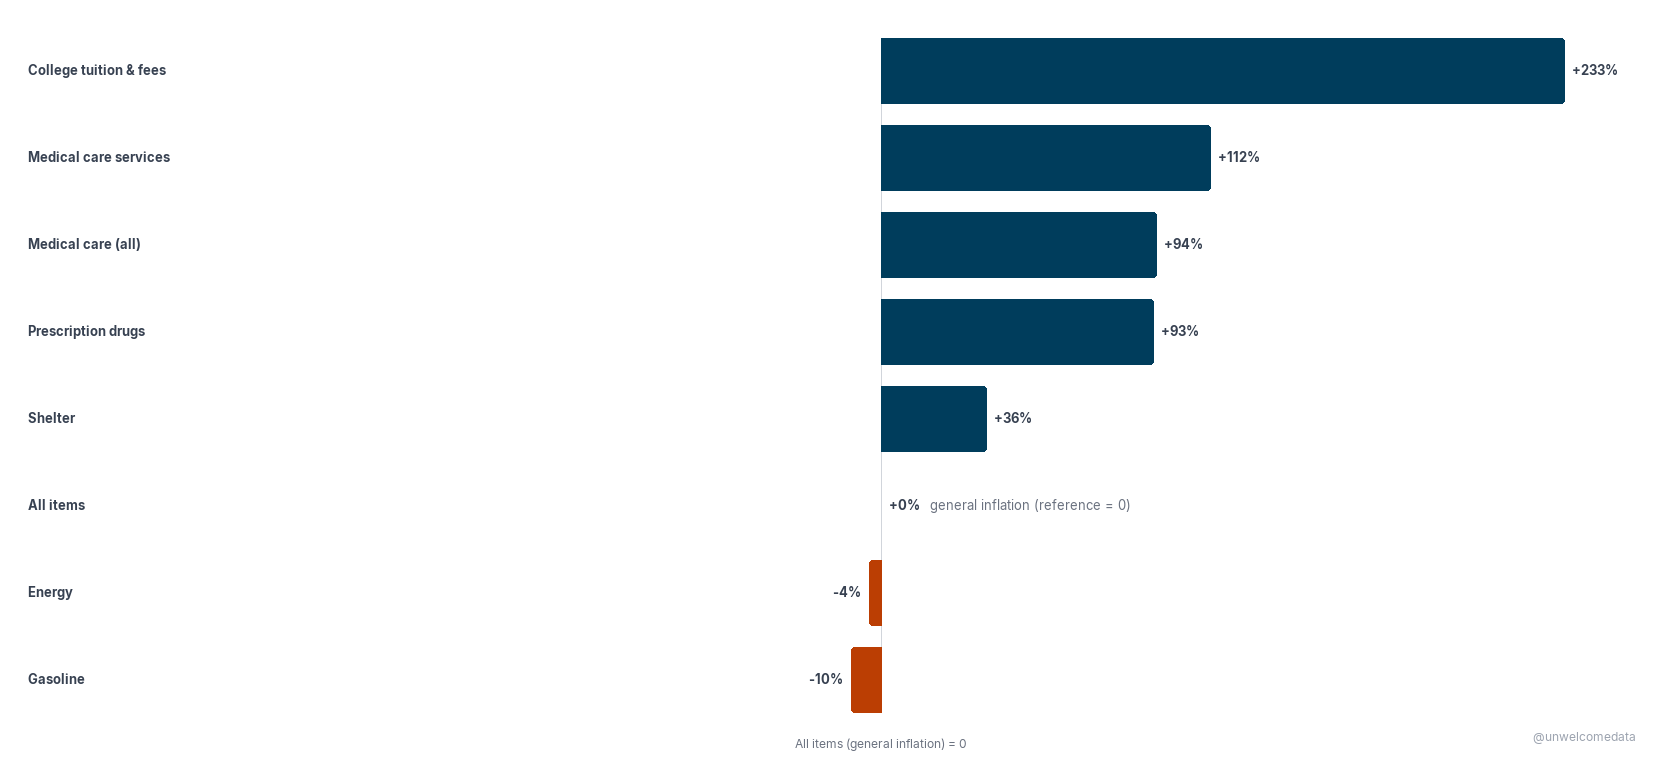
Published undergraduate tuition & fees, 1963-64 → latest, in constant dollars. Real (inflation-adjusted) sticker tuition at 4-year institutions, one line per control. The dollars are constant — the ≈ 4× climb for public 4-year (≈ $2,442 → ≈ $9,872) is real growth, not just inflation. Private is the top line. These are published (sticker) prices, not net of grant aid, and real prices have flattened/softened in the most recent years.
Where the money goes: core spending mix, 1987 → latest. Share of core functional spending nationally — instruction vs the three non-instructional functions (institutional support = admin, academic support, student services). Instruction’s share fell (≈ 48.8% → 43.1%) and non-instructional rose (≈ 32.5% → 37.4%) — but institutional support (admin) alone is roughly flat (≈ 14.7% → 15.3%). The honest read is “non-instructional spending outgrew instruction,” not “administrators alone exploded.” The series stitches the Delta Cost Project (1987–2012) to the IPEDS finance tail (2013+) with a seam at 2012.
How it was measured
The thesis is relative to inflation, deliberately: nominal tuition always rises, so “college got more expensive” is trivially true and uninformative. The question worth asking is whether tuition out-paced general inflation and the other big cost sectors — so every comparison here is indexed to a common base (1979 = 100) or expressed in constant (inflation-adjusted) dollars.
- Relative-inflation sector comparison (charts 1 & 2) uses BLS CPI-U sector sub-indices (U.S. city average, not seasonally adjusted, annual averages), re-indexed to 1979 = 100 and compared against All Items (general inflation).
- The long tuition series (chart 3) is NCES Digest Table 330.10, in NCES’s own constant dollars (CPI-U All-Items deflated).
- The spending mix (chart 4) uses the NCES Delta Cost Project (1987–2012) spliced to raw IPEDS finance (2013+), as shares of core functional spending.
Caveats that materially affect interpretation:
- Sticker price, not net of aid. The CPI tuition sub-index (charts 1 & 2) and the published tuition in chart 3 track charged / sticker price, not the net price students pay after grants and scholarships. Net price has risen more slowly than sticker price, so these charts describe the list price, not the typical out-of-pocket cost.
- “Admin” is a definitional choice. Chart 4’s “admin” is IPEDS institutional support only — a specific accounting category. Different definitions of administration yield different “bloat” magnitudes: microdata analyses of administrator headcount (e.g. FIRE / Kay & Honeycutt, 2025) find more admin growth than the IPEDS spending-share accounting shows. So “admin spending share is roughly flat” is true for this accounting measure and does not contradict headcount-based findings that administrators grew faster than faculty. The four core categories: instruction (teaching — faculty, departments, instructional activity); institutional support = admin (executive management, general administration, finance, HR, legal); academic support (libraries, academic computing, deans’ offices, curriculum support); student services (admissions, registrar, financial-aid administration, counseling, student activities).
- Energy and gasoline are volatile. Oil-linked prices swing sharply year to year, so a long-window cumulative comparison understates their short-run spikes — gasoline can be far above inflation in a given year even though it lagged inflation across the full 1979 → present window.
- 2025 figures are preliminary. The CPI series runs into mid/late 2025, and 2025 annual averages are still subject to minor revision by BLS.
Per-source collection methods, definitions, series breaks (GASB vs FASB accounting, the 2012 Delta→IPEDS seam, the 2012-13 IPEDS HR occupational-category break), and known controversies are documented in SOURCES.md.
The data
The published datasets are in export/:
higher_education_cost_cpi_sectors_v1.csv— CPI-U sector sub-indices re-indexed to 1979 = 100 (the data behind charts 1 & 2).higher_education_cost_tuition_longrun_v1.csv— constant-dollar published tuition & fees by control and level, 1963-64 → latest (chart 3).higher_education_cost_spending_mix_v1.csv— national share of core functional spending by year, 1987 → latest (chart 4).- A
*_codebook.mdaccompanies each dataset with a plain-English description of every column.
The richer packaging (Excel, Parquet), a combined institution-level dataset, and the full pipeline code are in the repo.
Reproduce it
The published datasets rebuild from raw sources with one command:
python scripts/reproduce.py
It runs the full pipeline — ingest → load → clean → prepare — using the same
logic the project uses throughout (in src/: ingest.py,
clean_quality.py, prepare.py). On the first run it downloads the BLS CPI-U
sector series, the NCES Digest tuition table, and the NCES Delta Cost Project +
IPEDS finance files (the URLs are in SOURCES.md) into data/raw/;
after that it runs offline. See scripts/README.md for the
run order, options, and the stage-by-stage breakdown, and
scripts/validate_charts.py for the pre-publish gate
that re-derives every headline figure in the four charts straight from the database.
Sources & license
Full attribution — publisher, URL, collection method, definitions, series breaks, and known controversies — is in SOURCES.md. In short: BLS Consumer Price Index (CPI-U), the NCES Digest of Education Statistics (Table 330.10), and the NCES Delta Cost Project + IPEDS finance and tuition records — all U.S. government works in the public domain. No crowd-edited sources are used.
Further exploration
- Administrator vs faculty headcount (IPEDS Human Resources, 2013 → present) — the complementary “bloat” cut, where administrators did outpace faculty and enrollment. Headcount (a count of people) tells a different story than spending share (a split of dollars); both belong in the picture.
- Per-state admin spending — how the admin-vs-classroom split varies across states and institution control.
- Net price vs sticker price — layering College Scorecard net-price data on top of the sticker series to show what students actually pay after aid.
AI-Assisted Development This project was built with the assistance of Kiro, an AI-powered development environment. All data-sourcing decisions, methodology choices, and published findings are the responsibility of the author. AI was used for code generation, data-pipeline construction, and research assistance — not for analysis conclusions or editorial judgment.