@unwelcomedata · data from public sources
DUI by state: what the laws are, and what the deaths say
A 51-state comparison (50 states + DC) of drunk-driving laws, penalties, and enforcement mechanisms set against the fatality outcomes those states actually record — built entirely from official U.S. government sources.
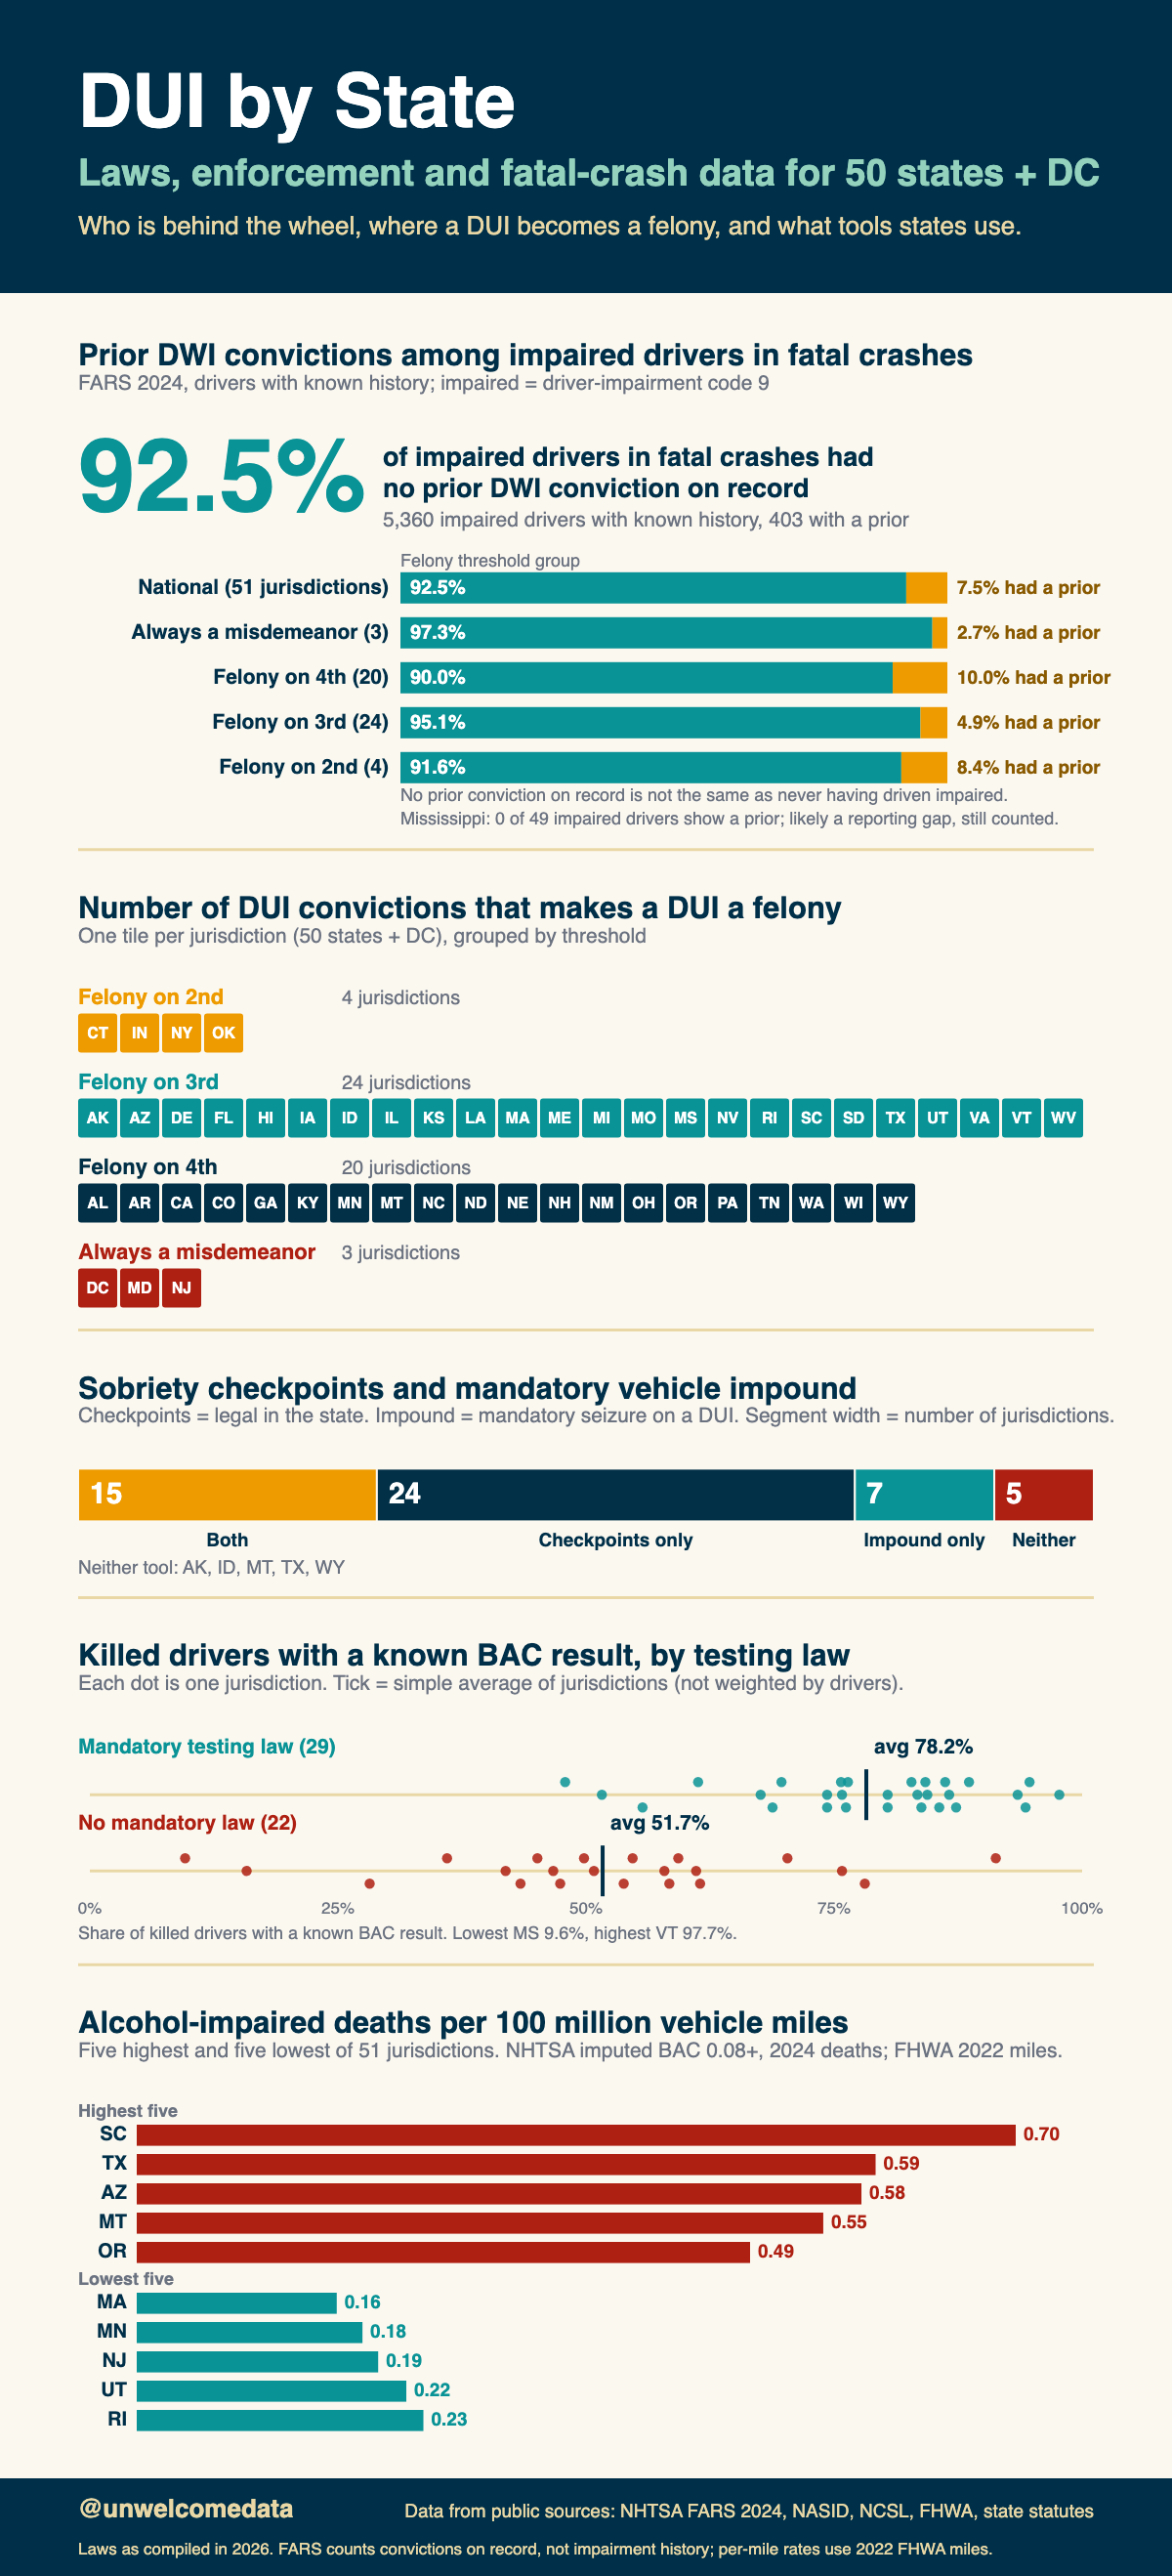
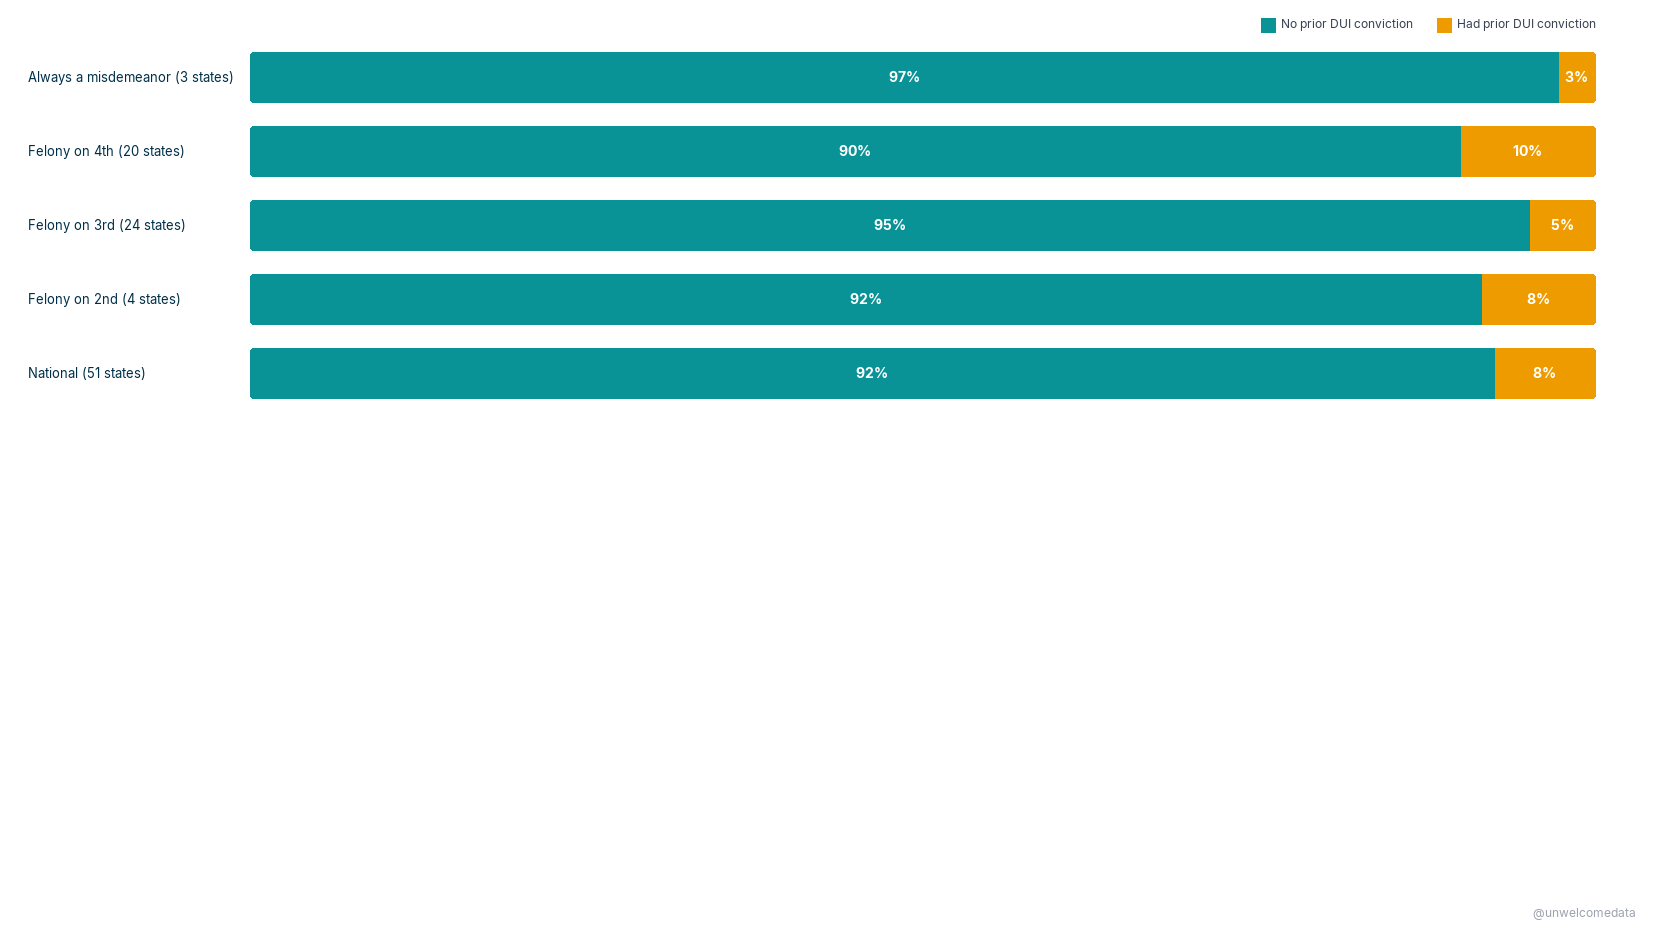
The finding that stuck: in 2024, the large majority of people killed in alcohol-impaired crashes were killed by drivers with no prior DUI conviction. The intuition that drunk-driving deaths are mostly caused by repeat offenders who slipped through the cracks isn’t what the federal crash data shows — most of the deaths trace to first-time offenders. And harsher penalty structures (felony thresholds, lookback windows, mandatory devices) don’t track with lower fatality rates once you account for how rural and how driven a state is.
The charts
Click any chart to open it at full resolution.
Most DUI deaths involve drivers with no prior DUI conviction. Share of drivers in fatal alcohol-impaired crashes who had a prior DUI conviction vs. none, with states grouped by their felony-DUI threshold. Note: no prior conviction is not the same as a first time driving impaired — it means no prior on record.
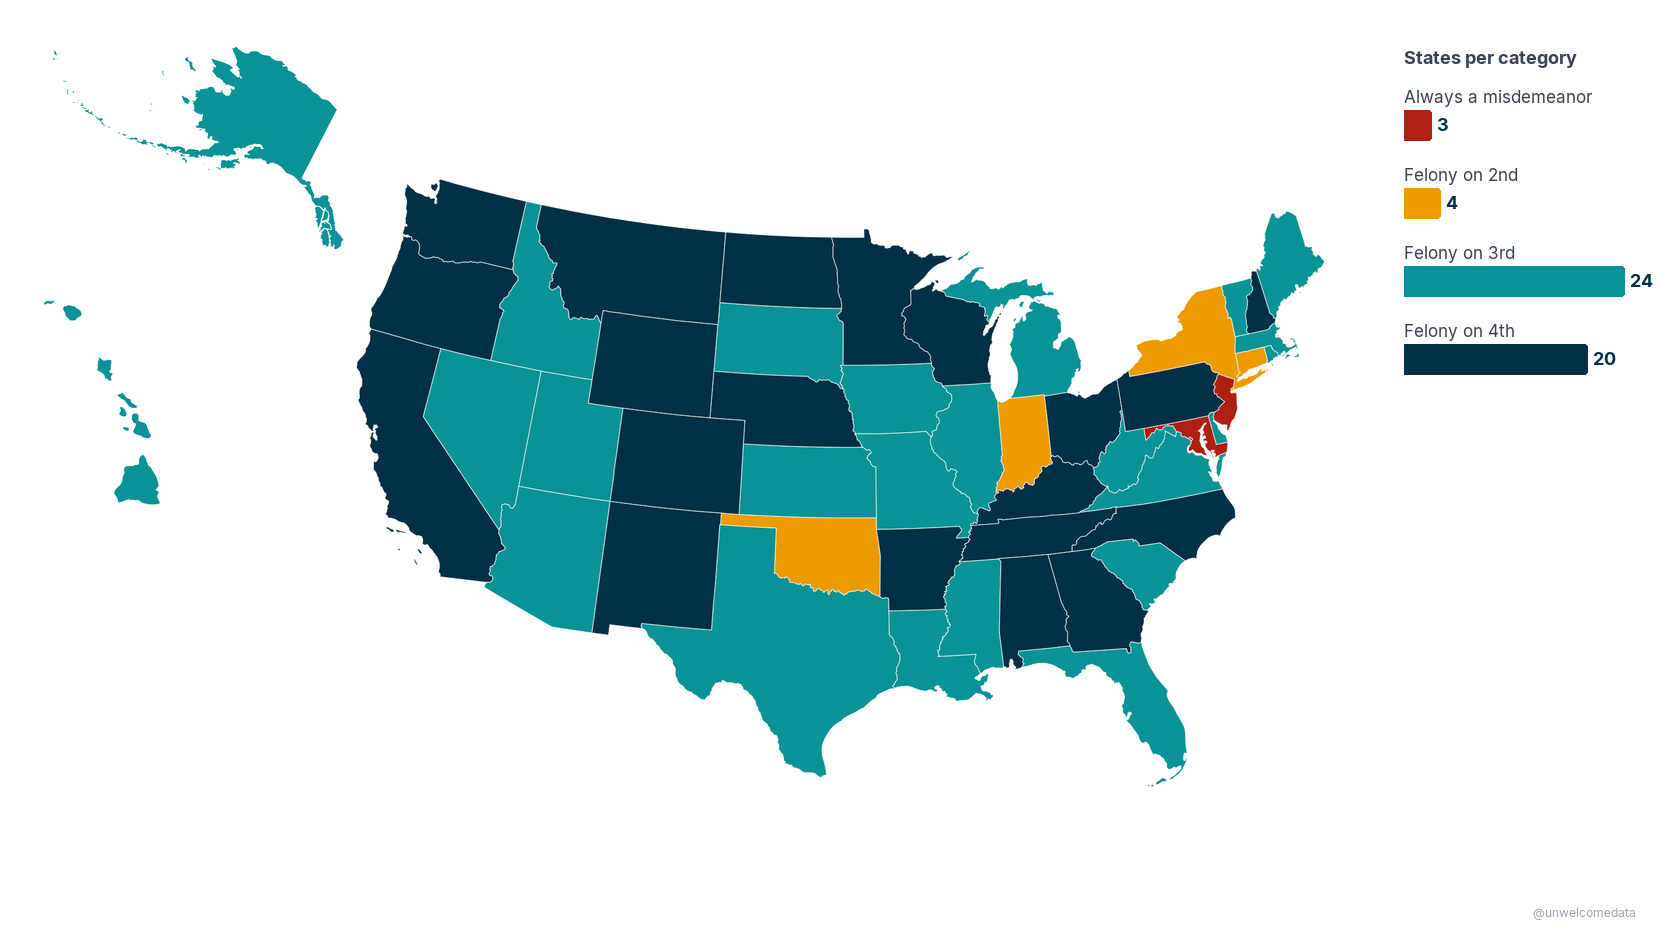
When does a DUI become a felony? The number of DUI convictions that triggers a felony charge, by state — always a misdemeanor, or a felony on the 2nd, 3rd, or 4th offense.
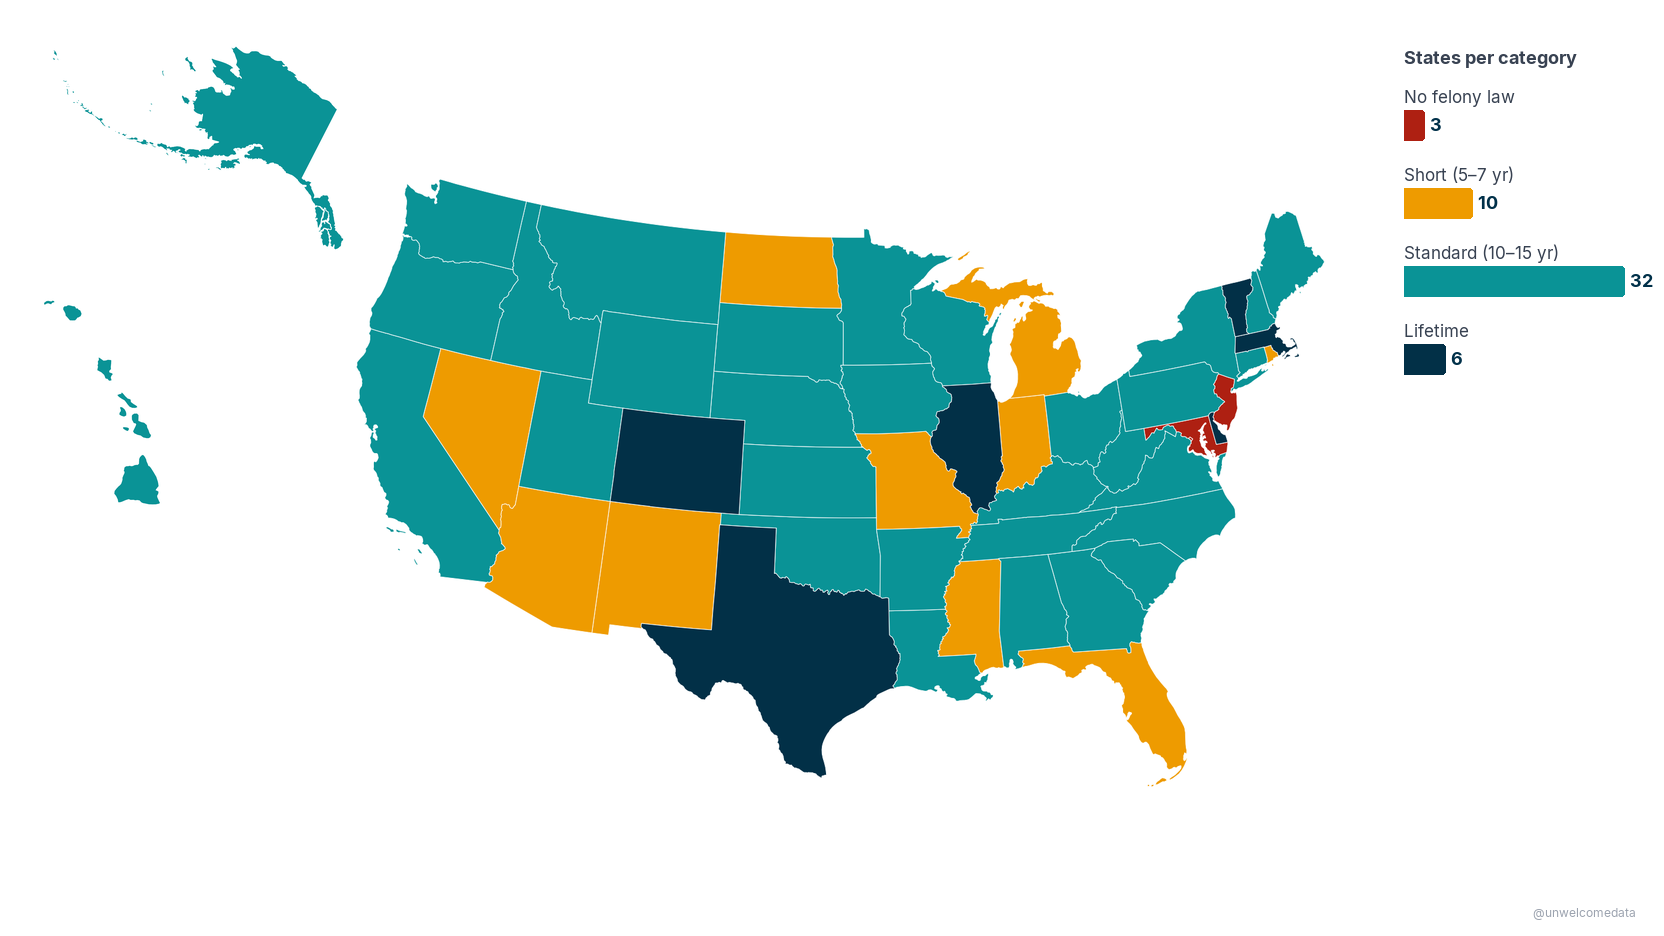
How long is the window to trigger a felony? The “lookback period” — how many years back a state counts prior offenses toward a felony charge (short 5–7 yr, standard 10–15 yr, lifetime, or no felony law at all).
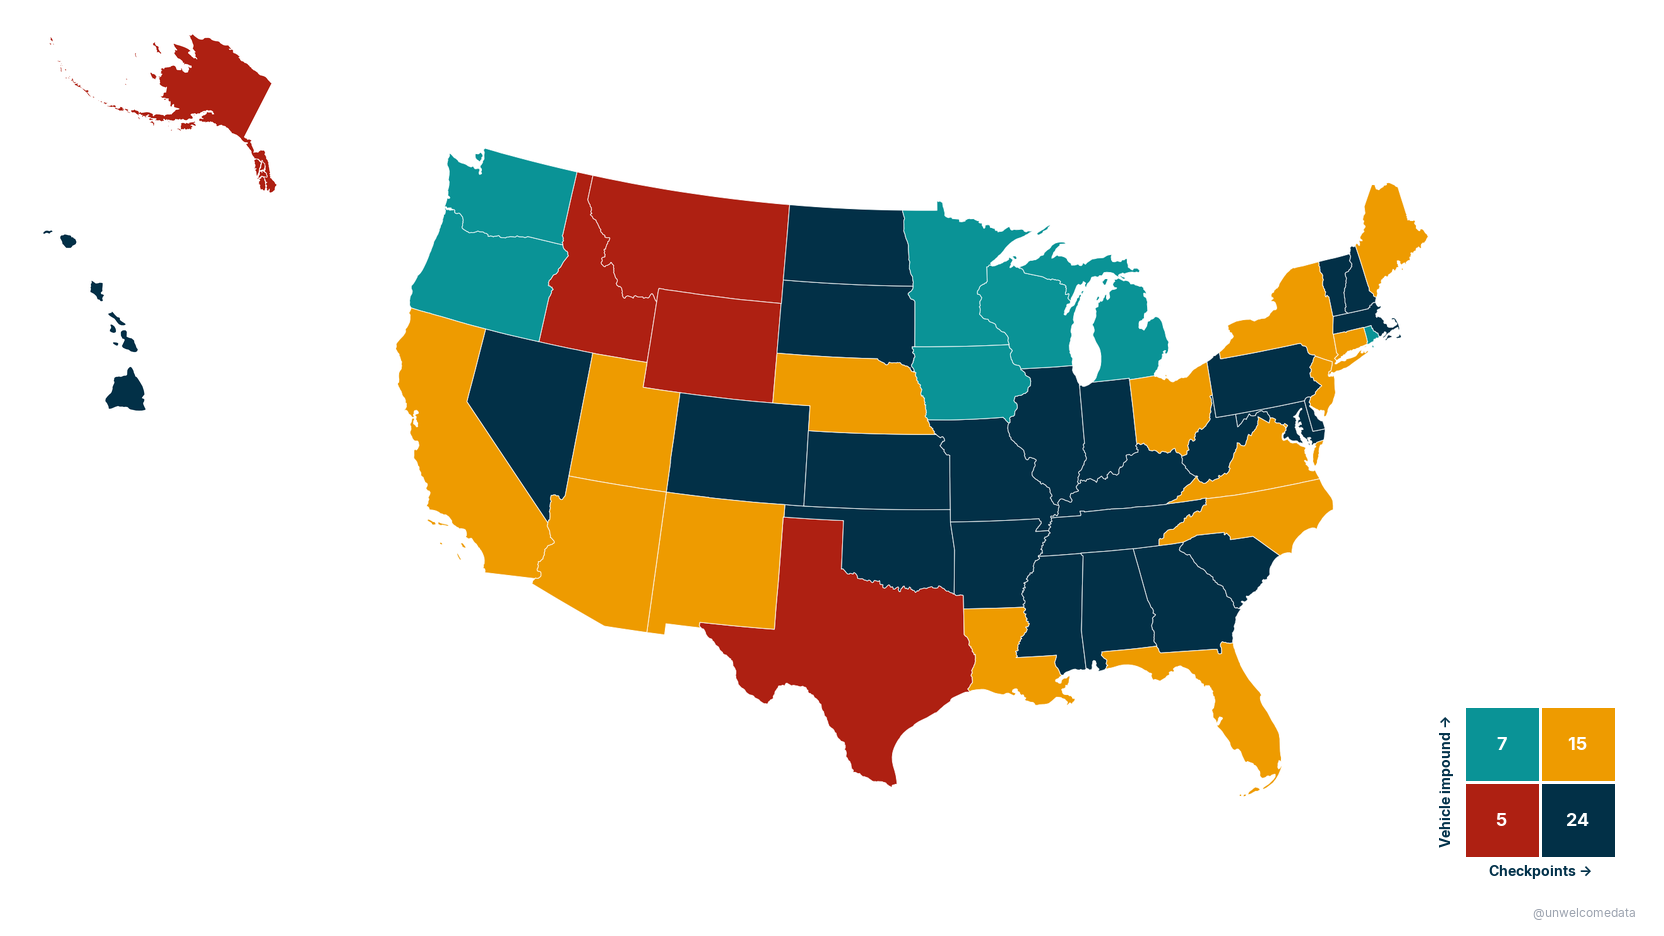
Can they stop you AND take your car? Two enforcement powers mapped together: checkpoints = sobriety checkpoints are legal; impound = mandatory vehicle seizure on a DUI. Dark = a state has both; gray = neither.
How it was measured
The dataset pairs two very different kinds of column:
- Laws and penalties — coded from state statutes and the National Conference of State Legislatures: felony thresholds, lookback periods, ignition-interlock mandates, checkpoint authority, vehicle impound/forfeiture.
- Fatality outcomes — from NHTSA’s Fatality Analysis Reporting System (FARS), the federal census of fatal traffic crashes.
A measurement caveat worth stating plainly. “No prior DUI conviction” in the crash data means the driver had never been convicted — not that they had never driven impaired before. It measures the justice system’s record, not the driver’s full history. So the finding is precise as stated (“most fatal-crash drivers had no prior conviction”) and should not be overread as “these people never drove drunk before.”
Two fatality definitions, kept separate. FARS raw coding and NHTSA’s statistically imputed alcohol-involvement estimate (BAC ≥ 0.08) don’t agree — imputation raises the count. The dataset carries both columns rather than blending them, and the codebook says which is which. NHTSA’s imputed figure is the one the agency treats as authoritative for alcohol-impaired fatality rates.
On penalty severity. States with harsher felony rules tend to show higher, not lower, fatality rates — but that’s confounded by rurality and region (rural, high-mileage states both drive more and legislate harder). This dataset is built for that kind of honest comparison, not to prove penalties cause outcomes.
Per-source collection methods, definitions, and known series breaks are in SOURCES.md.
The data
The published dataset is in export/:
dui_by_state_v4.csv— 51 rows (50 states + DC) × 48 columns: fatality outcomes, felony structure, enforcement mechanisms, penalties, and structural controls.dui_by_state_v4_codebook.md— a plain-English description of every column.
The richer packaging (Excel, Parquet) and the full pipeline code are in the repo.
Reproduce it
This one rebuilds from a script, with one manual step. The FARS source files are
large government downloads, and one Census reference table is behind a
download-protected page, so those inputs are placed in data/raw/ by hand (see
SOURCES.md for exact files and URLs). Once data/raw/ is
populated, the pipeline runs end to end:
python scripts/ingest_all.py                 # base tables → DuckDB
python scripts/scrape_nasid.py               # enforcement scrape (Playwright)
python scripts/clean_enforcement.py          # standardize enforcement text
python scripts/compute_bac_testing_rates.py  # BAC testing from FARS person file
python scripts/prepare_export_v4.py          # join → export/ + codebook
Full run order and per-script notes are in scripts/README.md.
Sources & license
Full attribution — publisher, URL, collection method, definitions, series breaks, and known controversies — is in SOURCES.md. In short: NHTSA FARS (fatal crashes), U.S. Census Bureau (population, geography), and NCSL + state statutes (laws and penalties). All are U.S. government or public sources; no crowd-edited sources are used. The compiled dataset is released by the author.
Further exploration
Open avenues left on the table:
- No-refusal jurisdictions (states that let police obtain a warrant for a blood draw on the spot) vs. fatality rates.
- BAC-testing rates over time — are states testing killed drivers more often?
- A “better/worse than expected” view that adjusts fatality rates for rurality and vehicle-miles-traveled before ranking states.
AI-Assisted Development This project was built with the assistance of Kiro, an AI-powered development environment. All data-sourcing decisions, methodology choices, and published findings are the responsibility of the author. AI was used for code generation, data-pipeline construction, and research assistance — not for analysis conclusions or editorial judgment.