@unwelcomedata · data from public sources
How genres rose and fell on the Billboard Hot 100
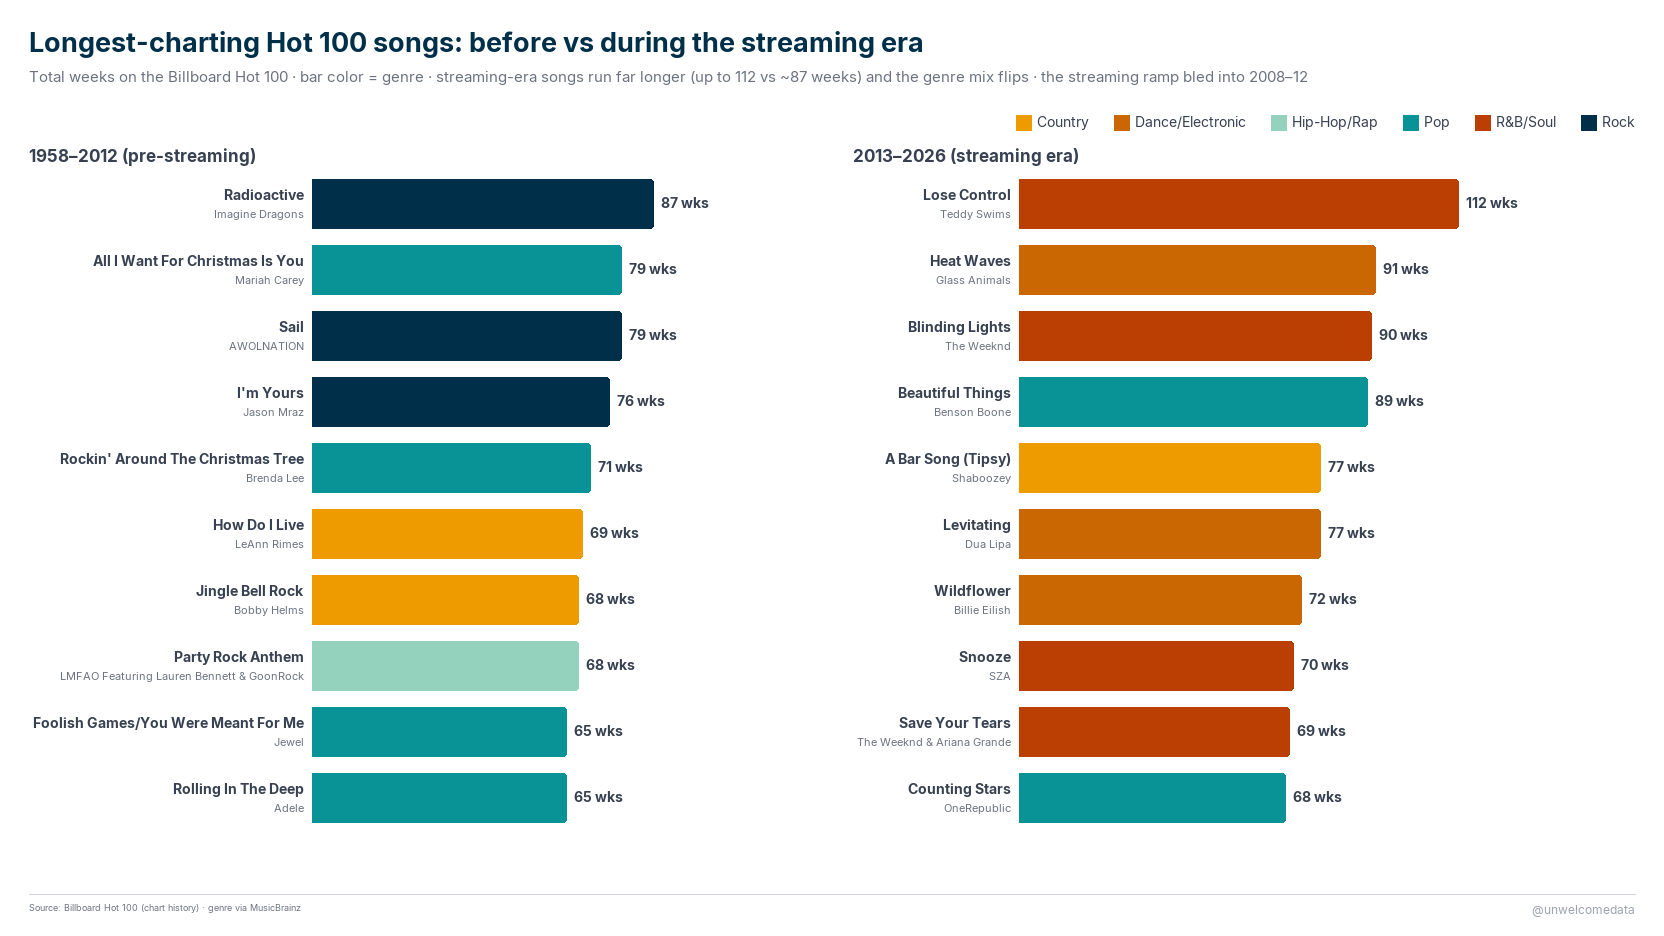
Seven decades of the Hot 100, read by genre. Rock ruled the chart from the 1970s into the 1990s, then slid to the bottom while Hip-Hop/Rap climbed from dead last to #1 by the 2020s — and when on-demand streaming entered the Hot 100 formula in 2013, songs started staying on the chart nearly twice as long (the record jumped from 87 weeks to 112) and the longest-charting hits flipped genre, away from Rock/Pop/Country toward R&B/Soul and Dance/Electronic.
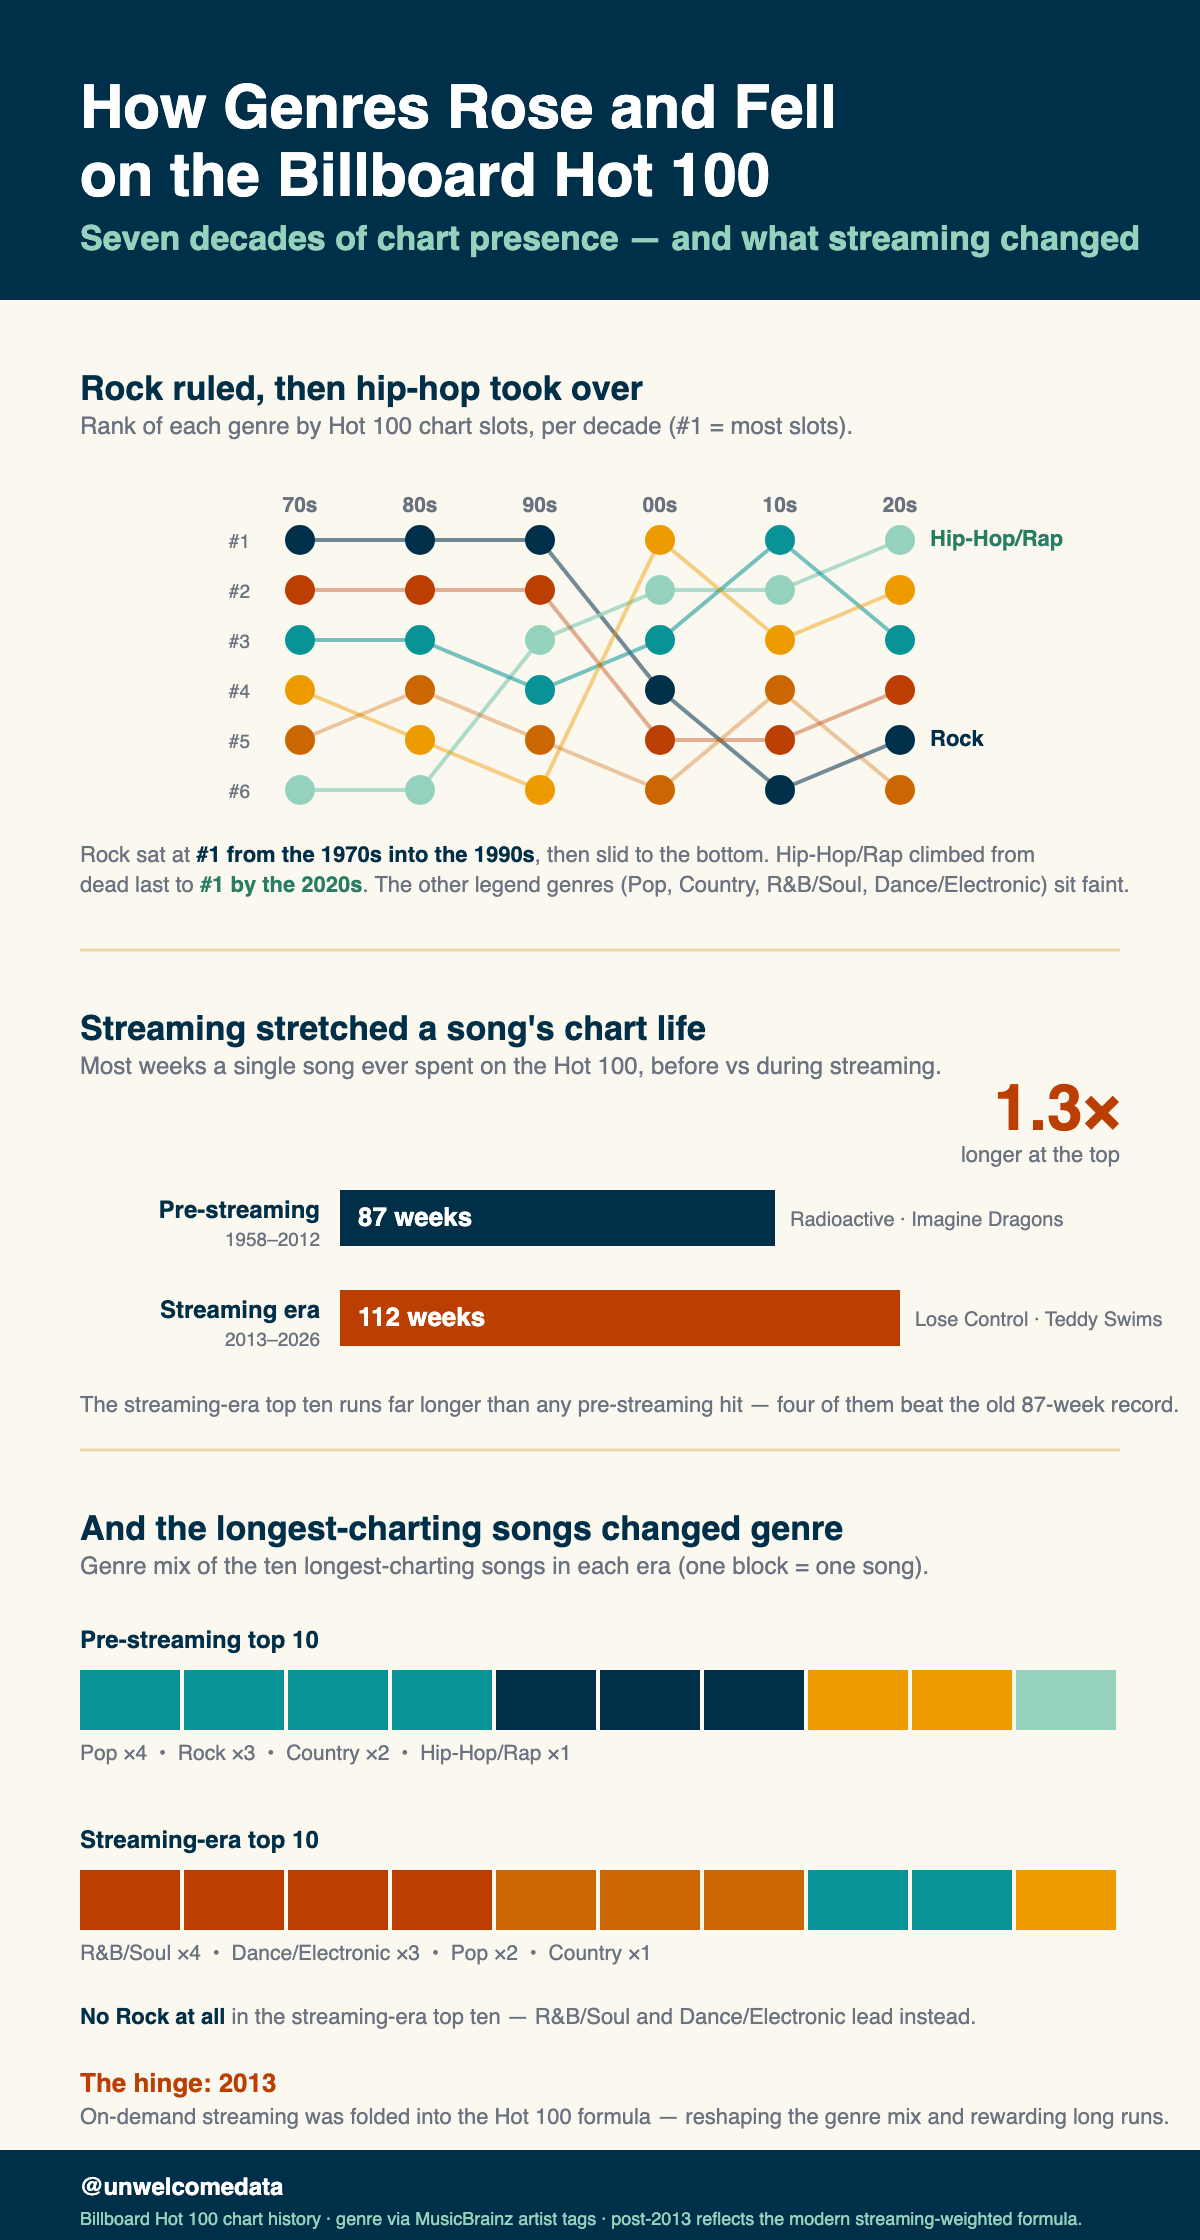
Click any chart to open it at full resolution.
How it was measured
Two things get measured here, both straight from Billboard’s own weekly Hot 100 chart history (1958–2026).
Chart presence by genre. Billboard carries no genre label, so each artist’s genre is assigned from MusicBrainz community tags — the single highest-count tag per artist wins (“top-tag-wins”), applied at the artist level across their whole catalog. A genre’s “chart presence” in a year or decade is how many Hot 100 slots its artists held. Genre is inherently subjective: a different taxonomy (Spotify, AllMusic, Billboard’s own genre charts) would shift the shares by a few points. Other/Unknown is a coverage residual — unmatched artists plus the long tail of acts with fewer than 20 Hot 100 appearances, which were below the enrichment threshold — not a musical category.
Chart longevity. “Longest-charting” means the total number of weeks a single song
ever spent on the Hot 100 (Billboard’s running weeks_on_chart field), counted per
song.
The load-bearing caveat — the Hot 100 formula changed. The Hot 100 ranks a blended metric: sales + radio airplay + online streaming. The weighting has shifted over the decades, and the hinge for everything here is 2013, when on-demand streaming (including YouTube) was folded directly into the formula (video and bundle rules shifted again around 2018–2020). So the post-2013 surge of Hip-Hop/Rap and Pop, and the much longer chart runs, are partly real listening and partly an artifact of the modern multi-metric, streaming-weighted formula — cross-era comparisons and the pre-/post-2013 longevity split carry that caveat. The year-axis charts mark 2013 directly; the decade and song charts note it in context.
1. The genre rank race, by decade and by year
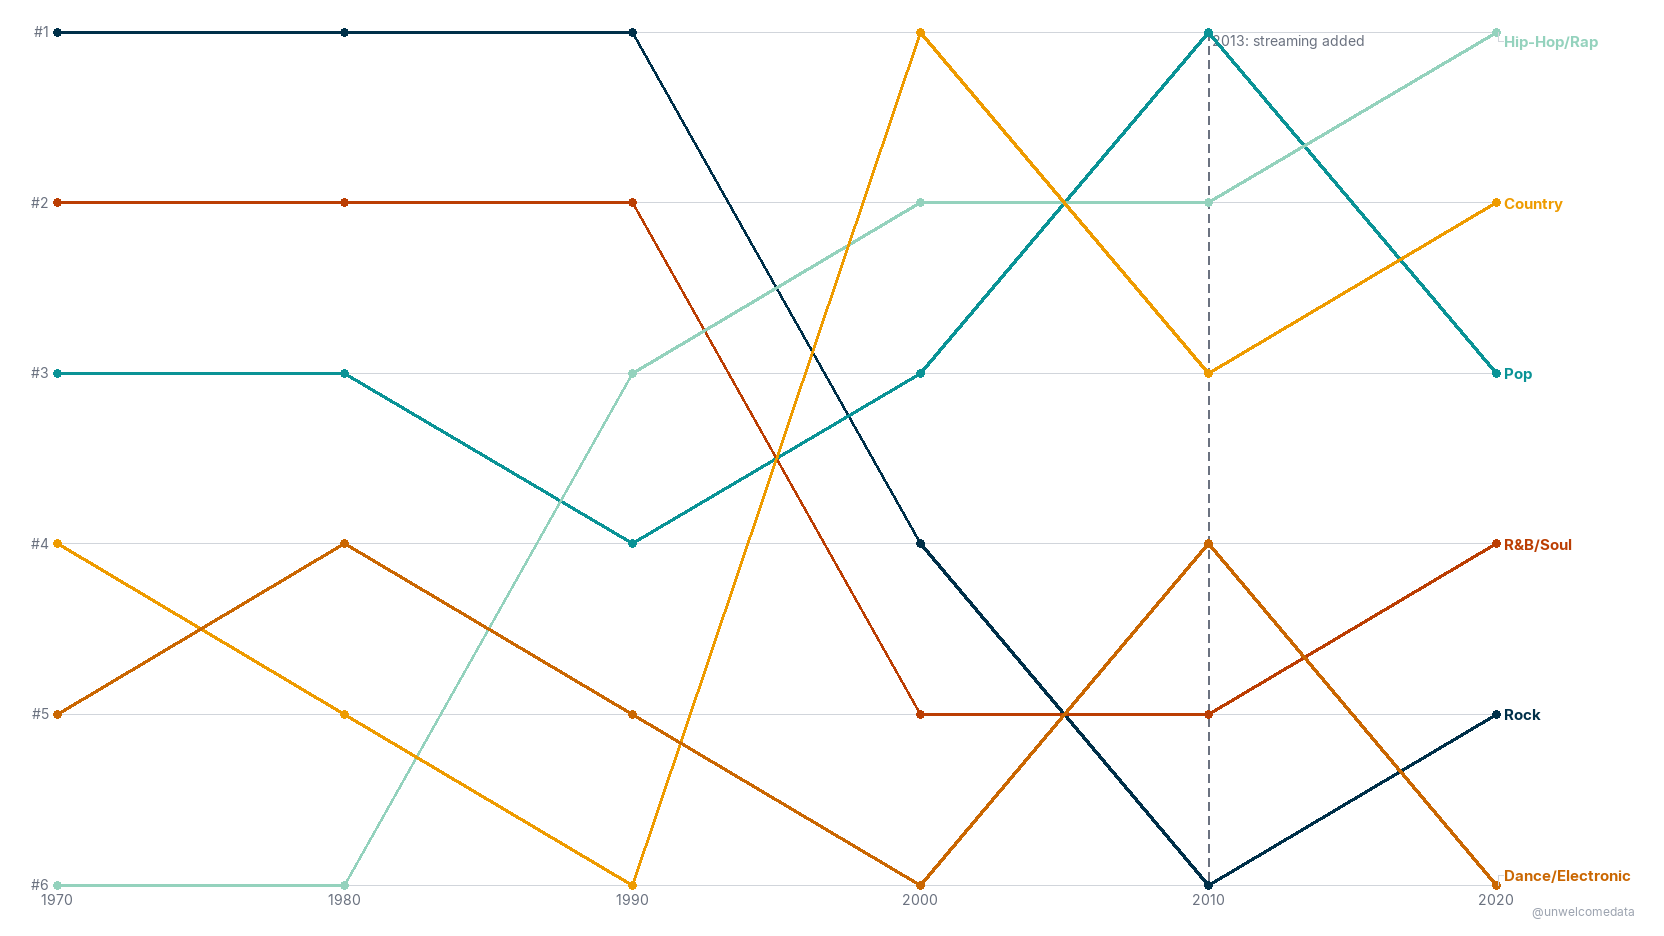
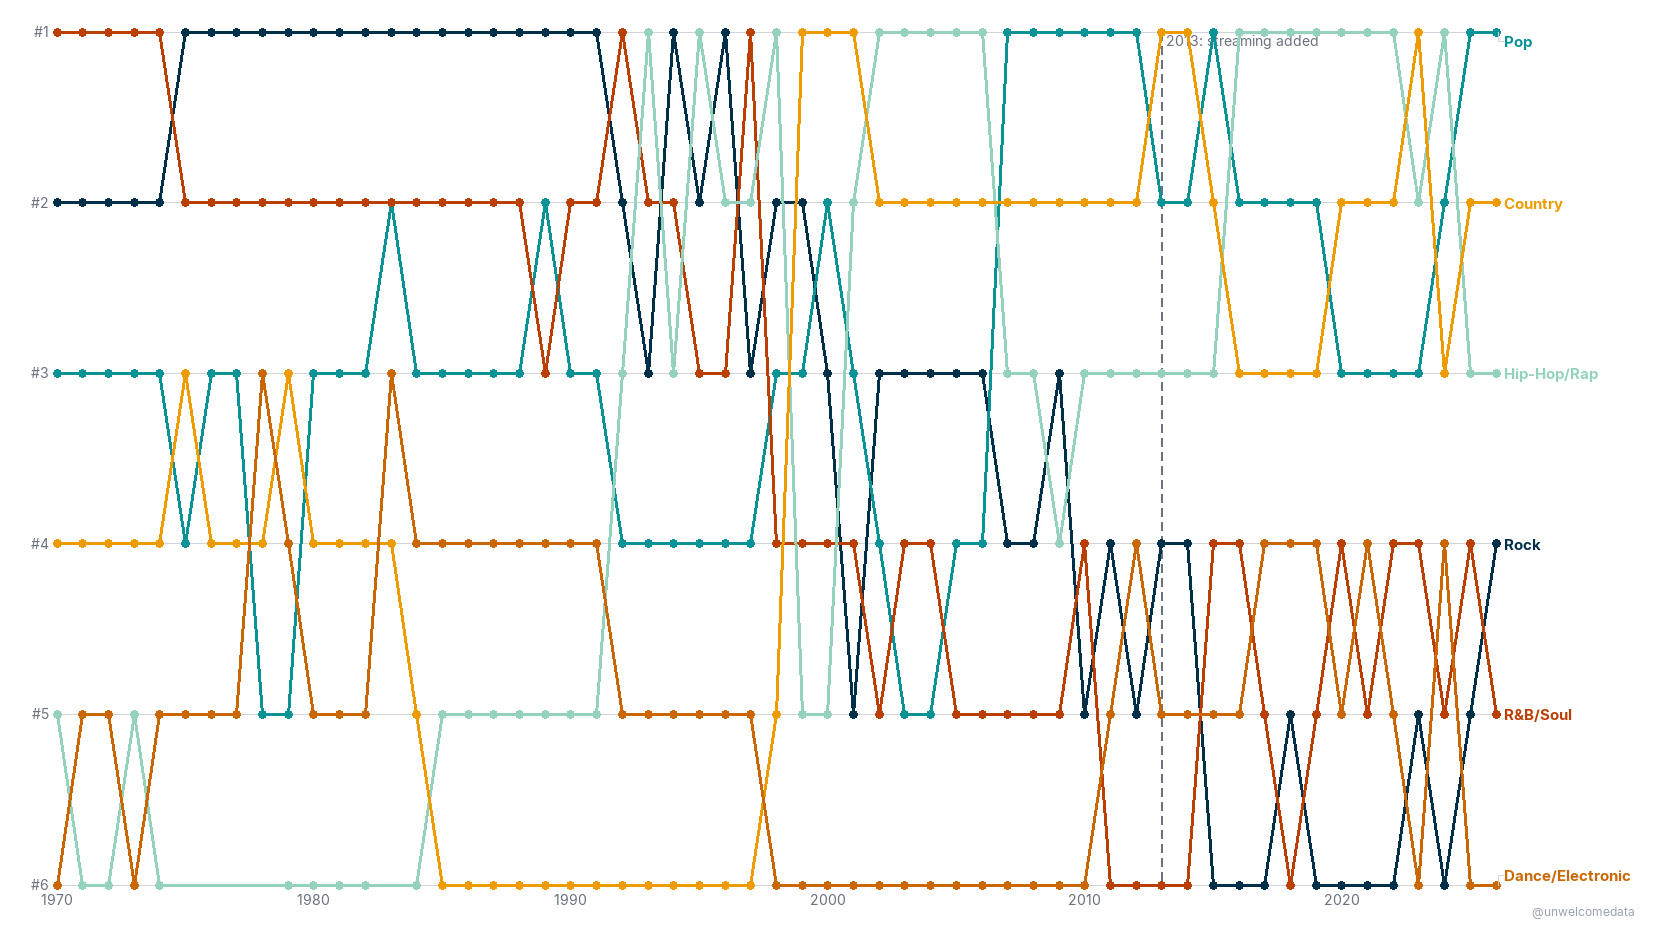
The lead chart tracks each of the top six genres by chart appearances (Rock, Pop, R&B/Soul, Hip-Hop/Rap, Country, Dance/Electronic) by its rank over time — rank #1 at the top. Two grains of the same race: the decade view reads the long arc at a glance, the by-year view shows every crossing. The dashed line marks 2013, when streaming entered the formula. (Other/Unknown is excluded from this ranking — it is a coverage residual, not a genre.)
By decade — the clean arc: Rock #1 from the 1970s into the 1990s, Hip-Hop/Rap to #1 by the 2020s.
By year — the detailed version, every annual crossing from 1970 on.
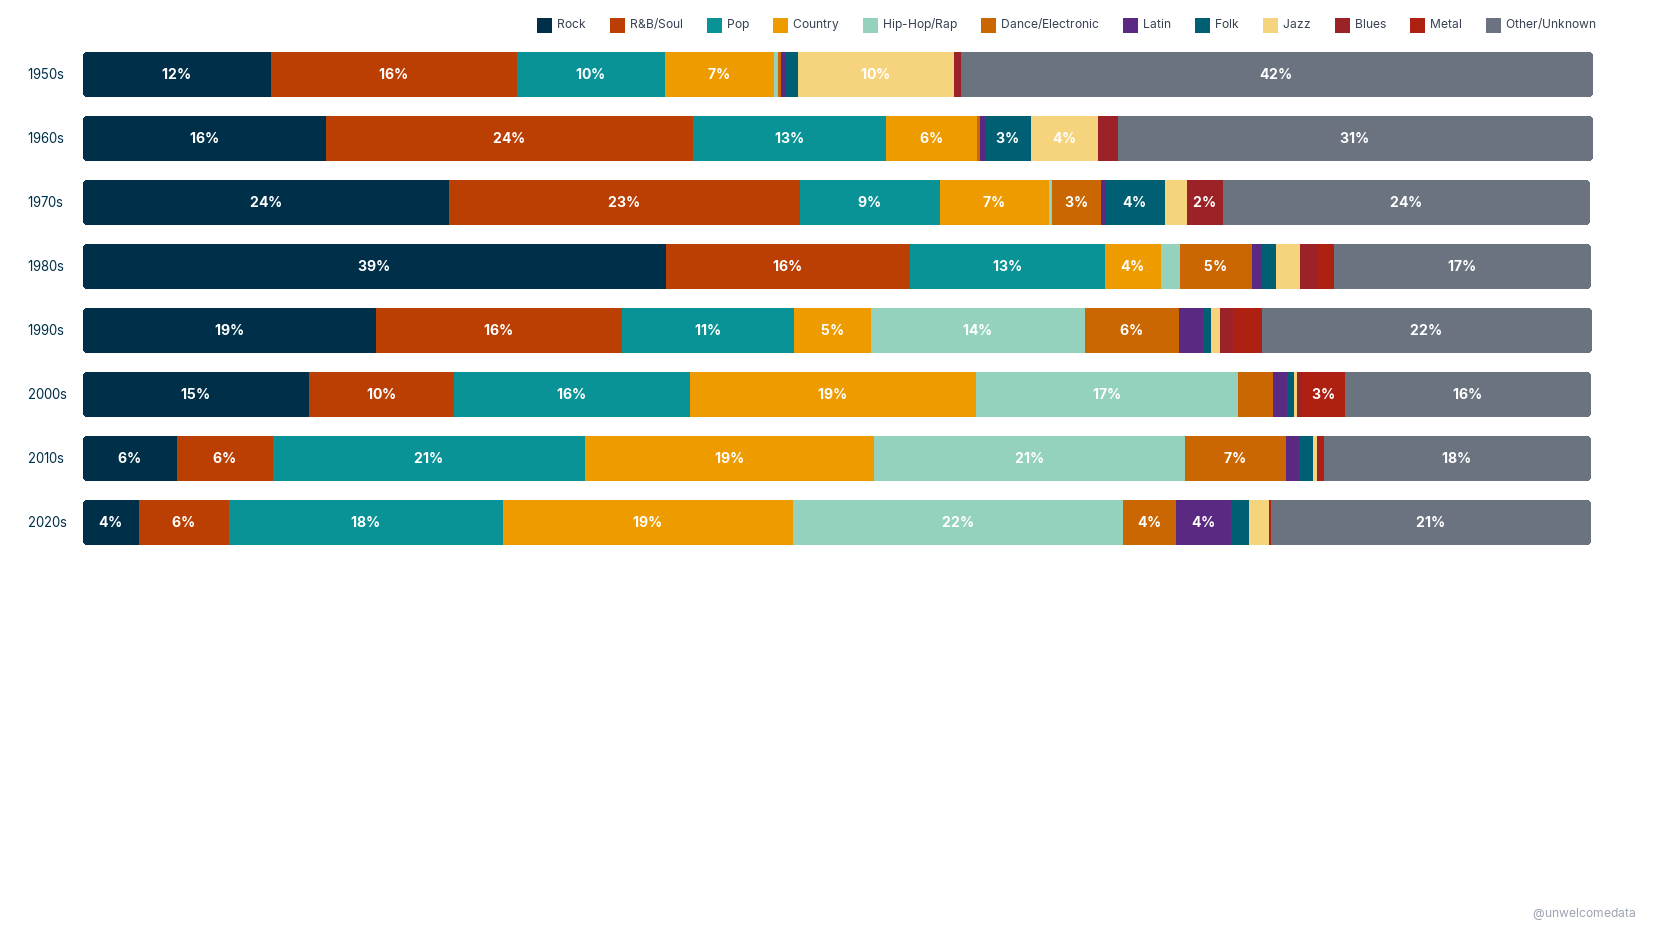
2. Genre share of the Hot 100, by decade
The “how much” companion to the rank race: each decade’s chart slots split across all twelve genres as a 100% stacked bar. It makes the Rock “mountain” of the 1970s–80s (nearly 40% of all slots in the 1980s) and the Hip-Hop/Rap surge of the 2010s–20s read as area. Other/Unknown (grey) is kept in deliberately — a part-of-whole has to sum to 100%, so hiding the coverage residual would misrepresent the early decades. The 2010s–20s decades reflect the post-2013 streaming-weighted formula.
3 & 4. The longest-charting songs — before and during streaming
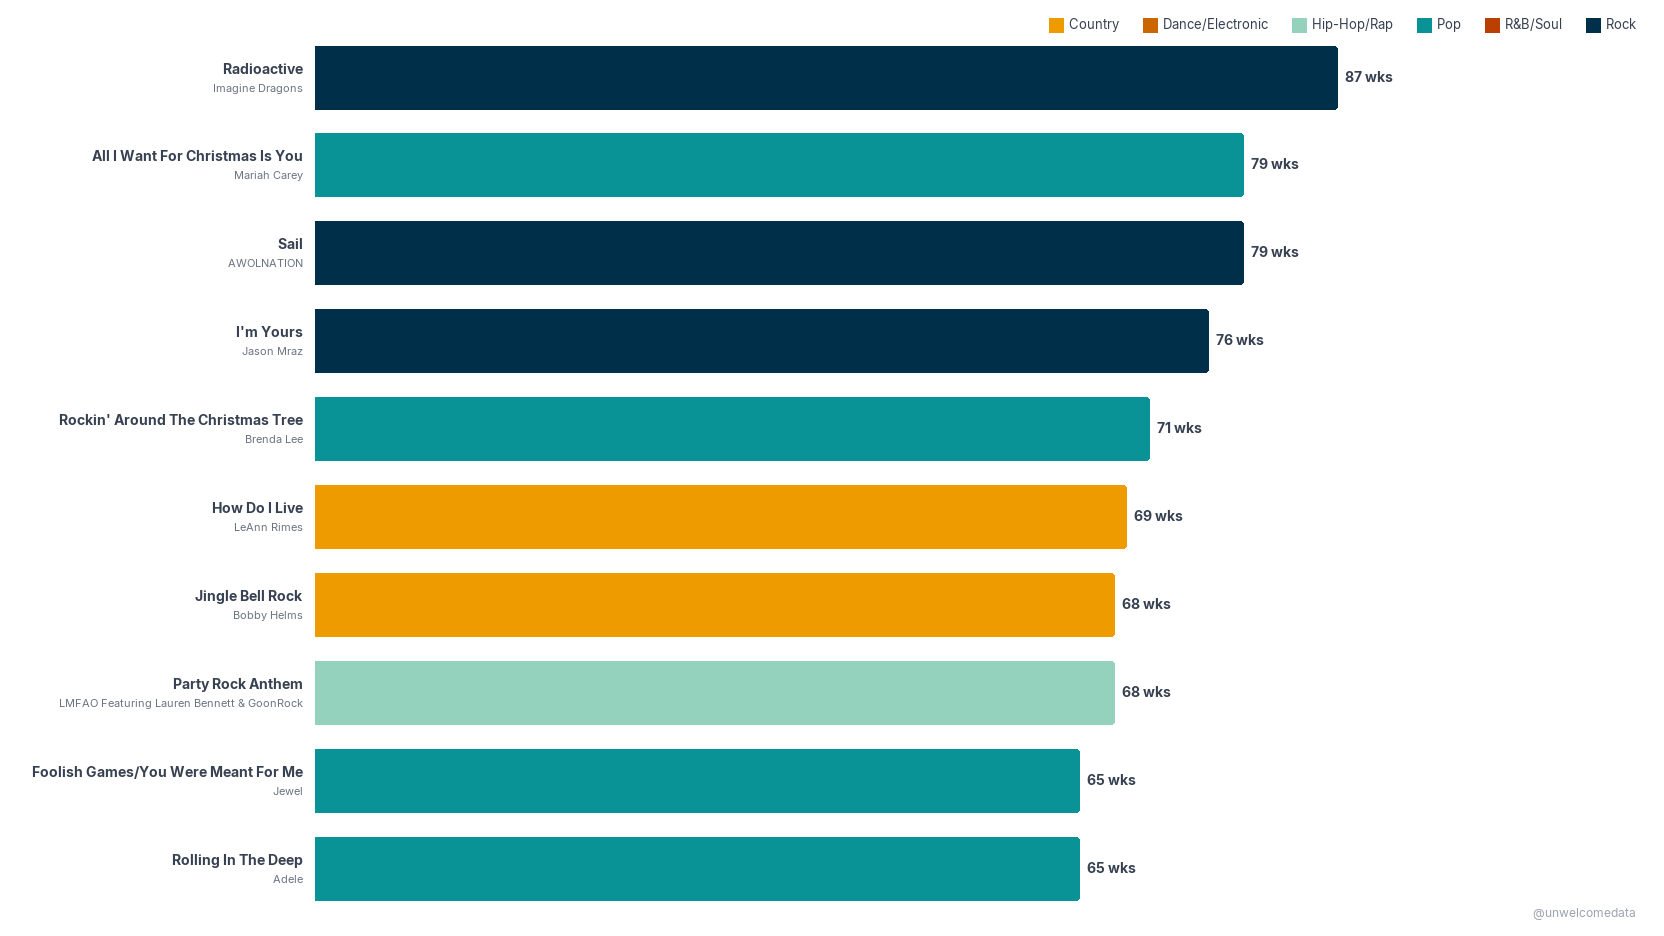
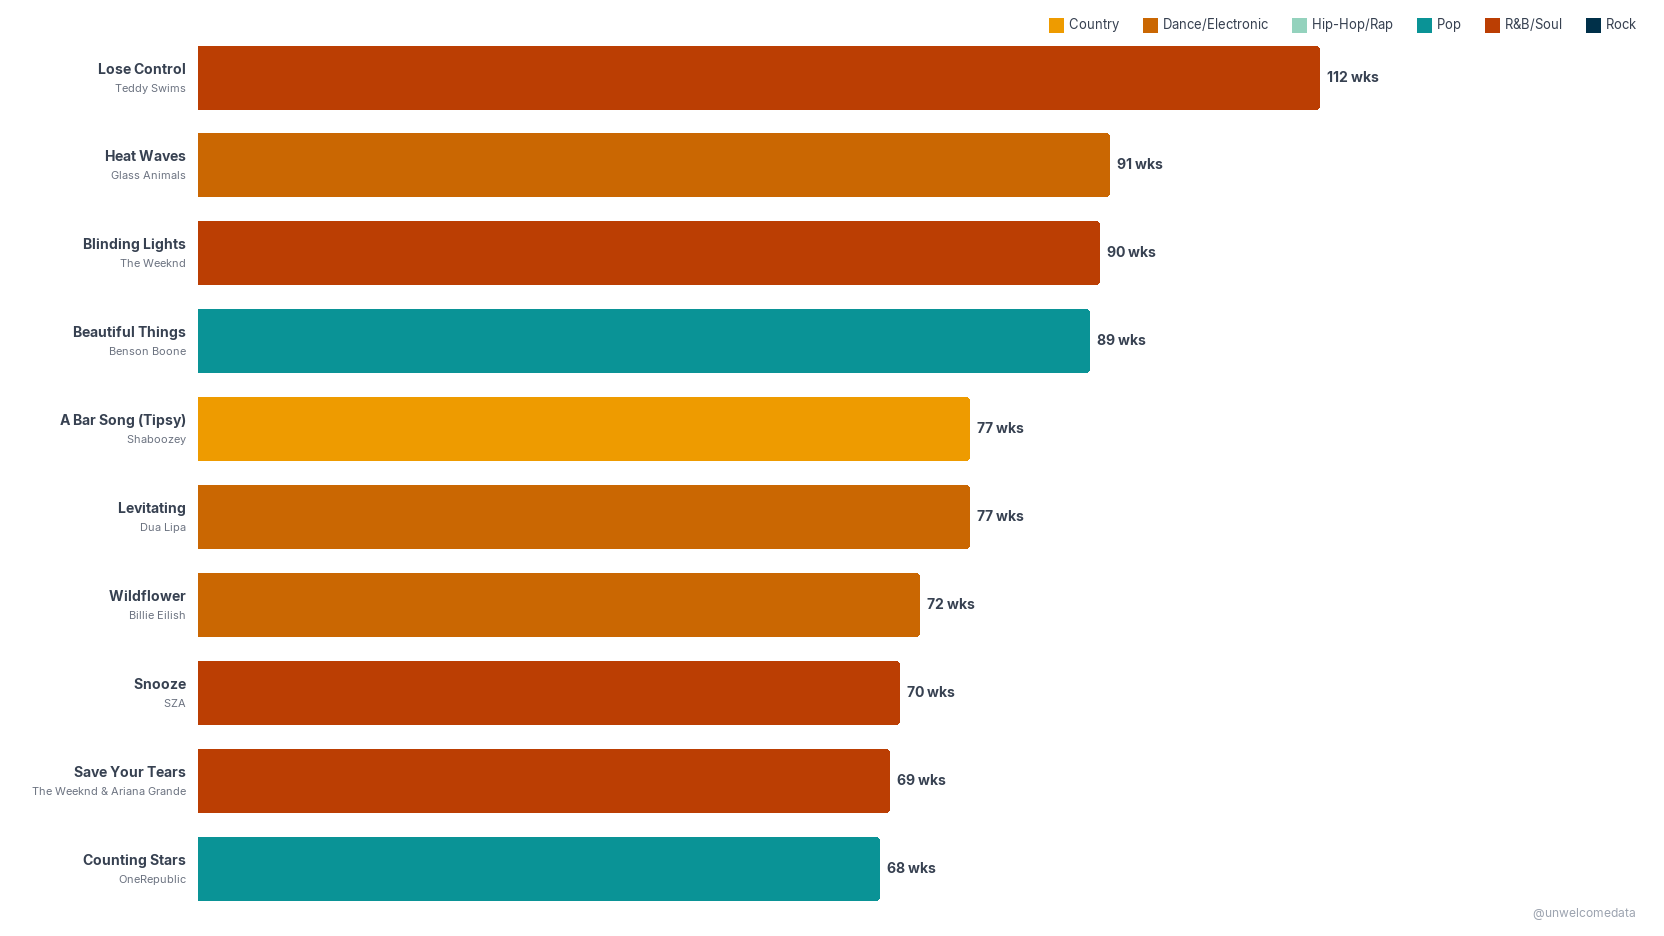
The ten songs that spent the most total weeks on the Hot 100 in each era, split at the 2013 streaming break. Each bar is a song (title as the label, artist beneath), colored by genre, with values in weeks on chart. The pre-streaming top is still dominated by 2008–2012 songs and perennial Christmas records (the streaming ramp had already begun bleeding in), topping out at 87 weeks (Radioactive). The streaming-era songs run far longer — up to 112 weeks (Lose Control) — and the genre mix flips: no Rock at all in the streaming top ten, which leans R&B/Soul, Dance/Electronic, and Pop.
Pre-streaming (first charted 1958–2012) — weeks on the Hot 100, by song, colored by genre; max 87 weeks.
Streaming era (first charted 2013–2026) — same metric and genre colors; max 112 weeks, and no Rock in the top ten.
Side by side — the two eras on a shared scale, so the longevity jump (≈87 → 112 weeks) and the genre-mix flip read in a single glance.
Explore any genre
Want a single genre’s full trajectory? The genre picker plots Hot 100 chart appearances per year, 1970 on, for any of the twelve genres (Blues, Country, Dance/Electronic, Folk, Hip-Hop/Rap, Jazz, Latin, Metal, Other/Unknown, Pop, R&B/Soul, Rock).
The data
The published datasets are here:
- billboard_hot100_genre_v1.csv — Hot 100 chart appearances by year and genre (year, genre, appearances, share, rank).
- billboard_hot100_longest_charting_pre_streaming.csv and …_streaming_era.csv — the two longest-charting song lists (song, artist, genre, weeks).
- A plain-English codebook accompanies each dataset (the
*_codebook.mdfiles inexport/) describing every column.
Sources & license
Full attribution — publisher, URLs, collection method, definitions, and the 2013 series break — is in SOURCES.md.
- Billboard Hot 100 chart history via the public
mhollingshead/billboard-hot-100dataset. Underlying chart © Billboard; used for non-commercial research only. - Genre tags via MusicBrainz (community-contributed, CC0 / CC-BY-NC-SA).
This is a fun, pop-culture read, not an official Billboard product.
AI-Assisted Development This project was built with the assistance of Kiro, an AI-powered development environment. All data sourcing decisions, methodology choices, and published findings are the responsibility of the author. AI was used for code generation, data pipeline construction, and research assistance — not for analysis conclusions or editorial judgment.